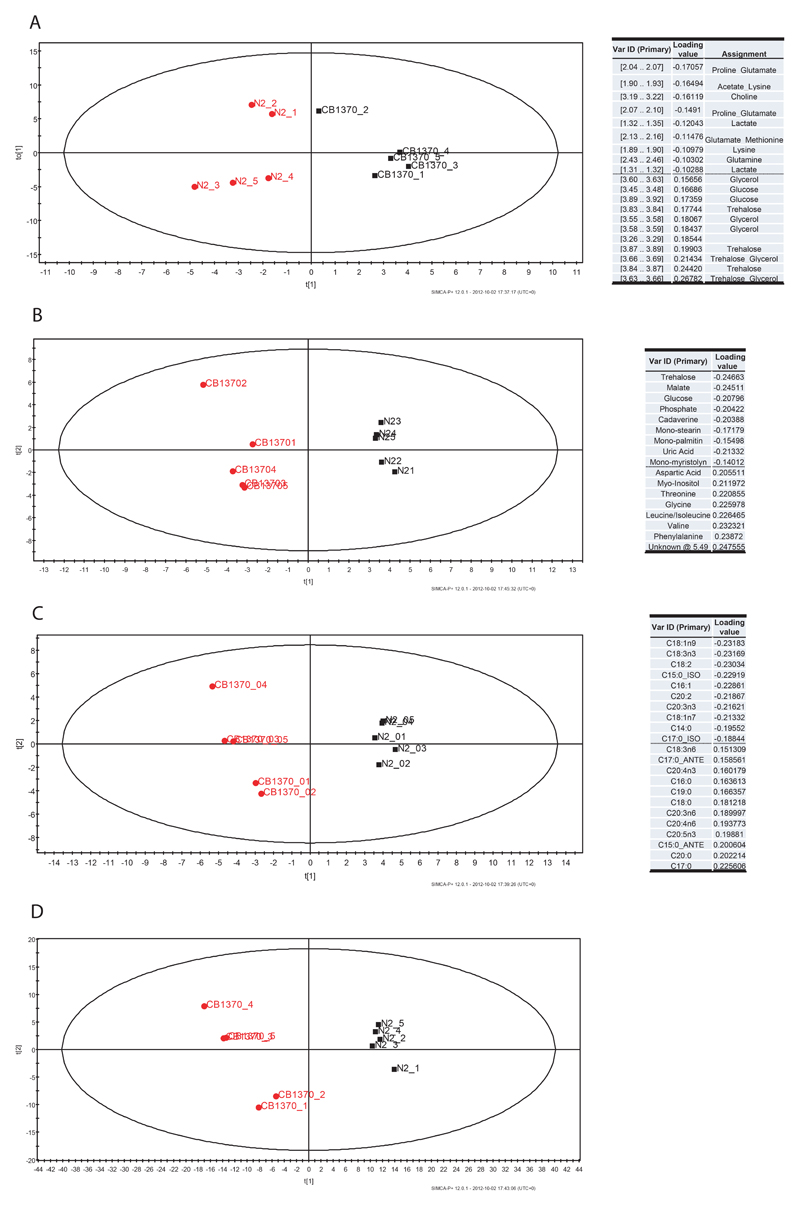
Figure 1.
Metabolomic analysis of daf-2(e1370) mutants at 20°. Score plots and loading tables showing the clustering pattern according to genotype and the metabolites responsible for separation in the profiles obtained by A. NMR spectroscopy, B. aqueous fraction and GC-MS, C. fatty acids in GC-MS, D. LC-MS in positive mode.

