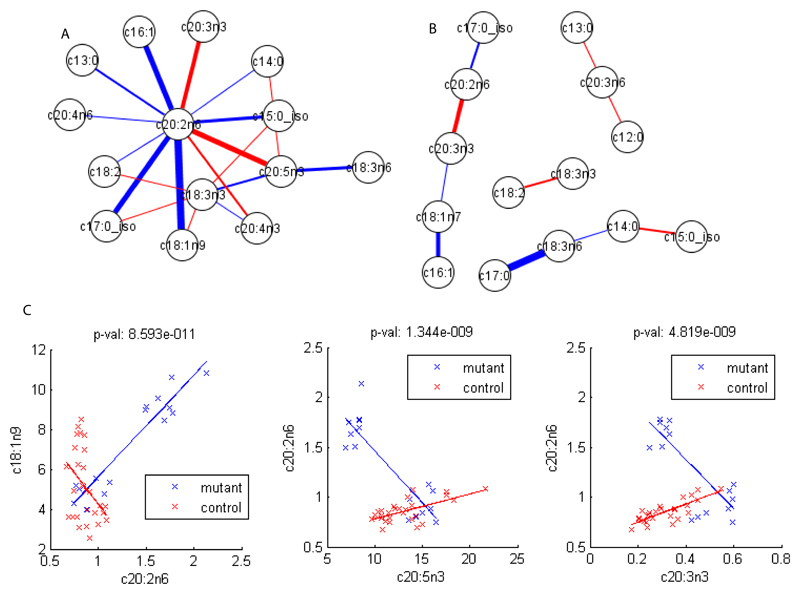
Figure 4.
Correlation analysis for metabolites from the GC-MS for daf-2(e1370) and the control at 25°. A. Differential network obtained considering Pearson correlation coefficients and a Bonferroni cut-off of 2.64e-6. Blue edges indicate a higher correlation in mutants, red a higher correlation in controls. B. Differential Gaussian graphical model obtained considering partial correlation coefficients. Again, blue edges indicate a higher correlation in mutants, red a higher correlation in controls. C. Biplots for Pearson correlation coefficients between couples of fatty acids with significant changes between mutants and controls.

