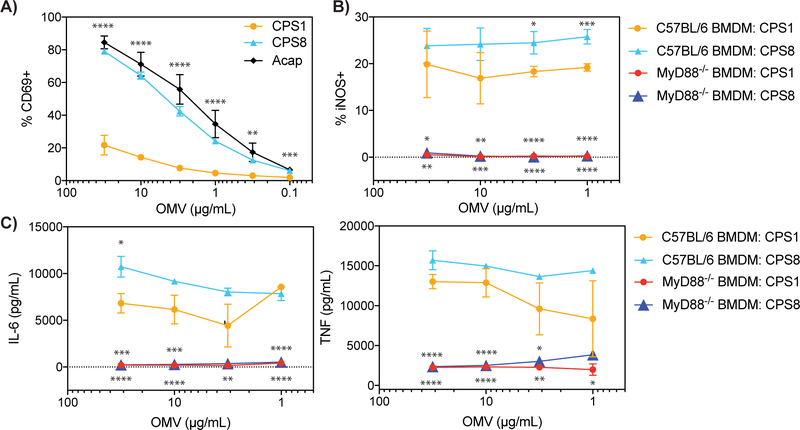
FIGURE 5. OMV CPSs have similar immunomodulatory effects on a B. theta dominant antigen as CPSs on whole bacteria.
(A) Percentage of CD69 expressing BθOM T cells with CPS1, CPS8, and Acap OMVs loaded onto BMDM (CPS1 and CPS8: n = 7, three experiments; Acap: n =3, two experiments).
(B) Percentage of iNOS expressing C57BL/6 or MyD88−/− BMDM after a 24 hour culture with CPS1 and CPS8 OMVs (n = 6, three experiments).
(C) IL-6 and TNF levels in picogram per milliliter produced by C57BL/6 or MyD88−/− BMDM and after a 24 hour culture with CPS1 and CPS8 OMVs (n = 6, three experiments).
Data represent mean ± SEM. One-way ANOVA analysis: (A-C) ∗p < 0.05, ∗∗p < 0.01, ∗∗∗p < 0.001, ∗∗∗∗p < 0.000. 5B and 5C * above the CPS8 line are comparing CPS1 vs CPS8, * above red/blue triangles are comparing CPS1 vs MyD88−/− CPS1, and CPS8 vs MyDD8−/− CPS8.

