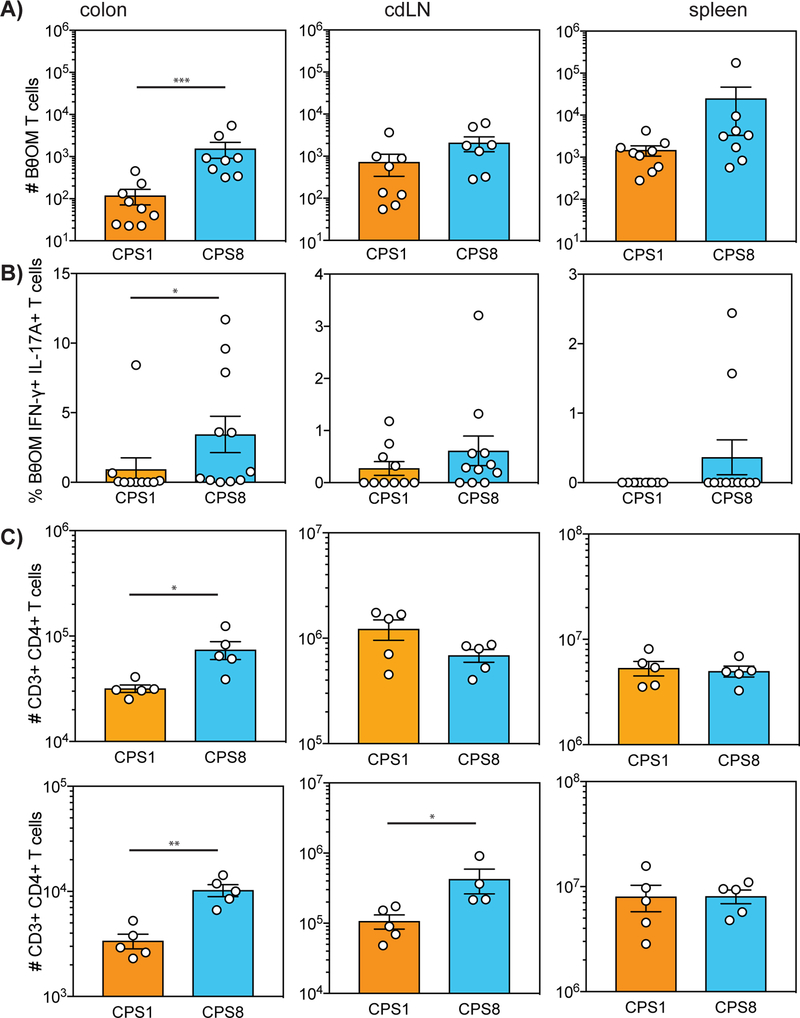
FIGURE 6. CPSs modulate antigen-specific and polyclonal T cell responses in vivo.
(A and B) (A) Number of live CD4+ CD45.1+ BθOM T cells and (B) % of BθOM IFN-γ+ IL-17A+ T cells in the colon, colon-draining lymph node (cdLN), and spleen of SPF Rag1−/− mice gavaged with CPS1 or CPS8 and adoptively transferred with BθOM T cells three days later (n = 24 mice, three experiments).
(C) Number of T cells among live leukocytes that are CD3+ CD4+ in the colon, cdLN, and spleen of germ free mice gavaged with CPS1 or CPS8. (n = 20 mice, two experiments)
Data represent mean ± SEM. Mann-Whitney test for non-normally distributed data: (A) ∗∗∗p < 0.001, (B) ∗p < 0.05, (C) ∗p < 0.05, ∗∗p < 0.01.

