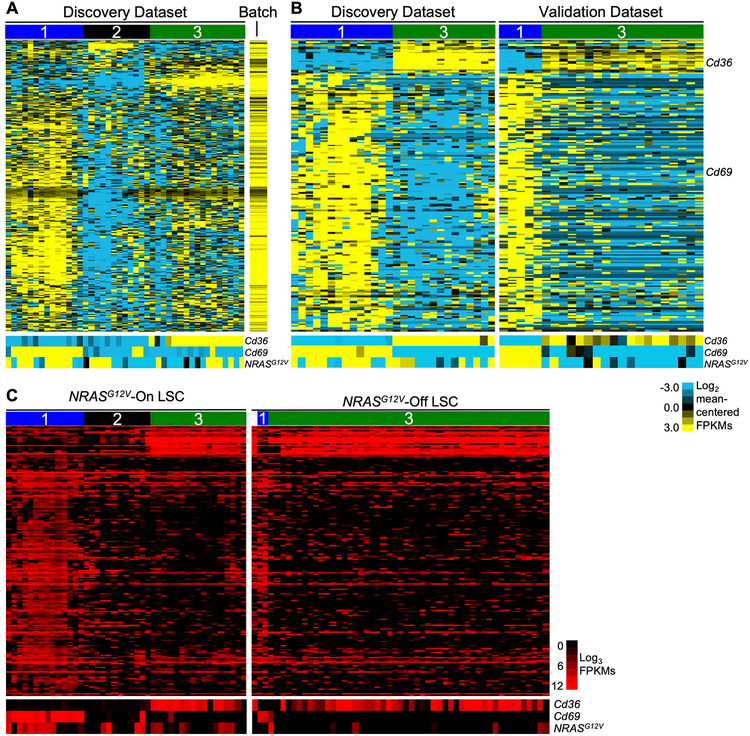
Figure 1.
Single-cell RNA sequencing identifies three distinct gene expression profiles in immunophenotypic LSCs. Primary leukemia cells harvested from the spleen of a leukemic mouse were sorted to isolate the LSC-enriched fraction (Mac1LowKit+Sca1+). This sorted population was stained for viability and captured in microfluidic chambers (1 cell per chamber, C1 Single-Cell Auto Prep System, Fluidigm, South San Francisco, California) and processed to isolate RNA. Chambers were visualized to select single, live cells for cDNA library creation and sequencing. A single cDNA library was generated per cell. An aliquot of cells was used to generate bulk RNA for sequencing as a population control. Each single-cell library was sequenced to a depth of 1–3 million reads per cell (100 bp, paired-end reads) to generate the discovery dataset. Cells with > 75% alignment were used for analysis. A, Unsupervised two-dimensional hierarchical clustering of single-cell RNA sequencing data from Mac1LowKit+Sca1+ leukemia cells in the discovery dataset (n=42). To generate this analysis, normalized expression values from each cell were mean-centered. The colors on the heatmap represent relative expression of each gene in each cell in comparison to all the cells in the dataset. Mean expressed genes per cell=3,171; range=1,491–5,387. Bottom panel: heatmap of Cd36, Cd69, and NRASG12V expression in corresponding cells. Normalized expression values (FPKMs) were mean centered (FPKM value for each gene was divided by the mean FPKM value of the gene for the entire dataset) and log2 transformed. B, Primary leukemia cells were harvested from the spleen of a second leukemic mouse and processed for single-cell capture and RNA sequencing (as described above) to generate a validation dataset (n=33, mean expressed genes per cell=2,680, range=1,392–4,409). Genes differentially expressed between Cd69High (Group 1) and Cd36High (Group 3) cells in both datasets were used to generate heatmaps. In this panel, the discovery dataset is reproduced from Fig. 1A, but Group 2 (Cd36LowCd69Low) cells are omitted from this analysis to aid in visualization. As in panel A, normalized expression values were mean-centered and log2 transformed. C, A leukemic mouse was treated with doxycycline to abolish NRASG12V transgene expression. Primary leukemia cells were harvested from the spleen of this mouse after 72 hours of treatment. These “Ras-Off” leukemia cells were sorted to isolate Mac1LowKit+Sca1+ (MKS) cells and processed for single-cell capture and RNA sequencing (as described above) to generate the Ras-Off single-cell dataset (n=51, mean expressed genes per cell=2,355, range=1,576–4,035). We used the 197 common differentially expressed genes (defined in the Ras-On datasets) to perform one-dimensional hierarchical clustering of the single-cell transcriptional data of sorted LSCs from all of these datasets. Bottom panels: heatmap of Cd36, Cd69, and NRASG12V expression in corresponding cells. Unlike the analyses in panels A and B, where the data was mean-centered to highlight genes that were differentially expressed within the dataset, these data represent FPKM expression values that were not mean-centered. As there was little cell-to-cell variation in the expression of these genes in the NRASG12V-Off dataset, mean-centering the values would have obscured differences between Group 1 and Group 3 genes in this dataset.

