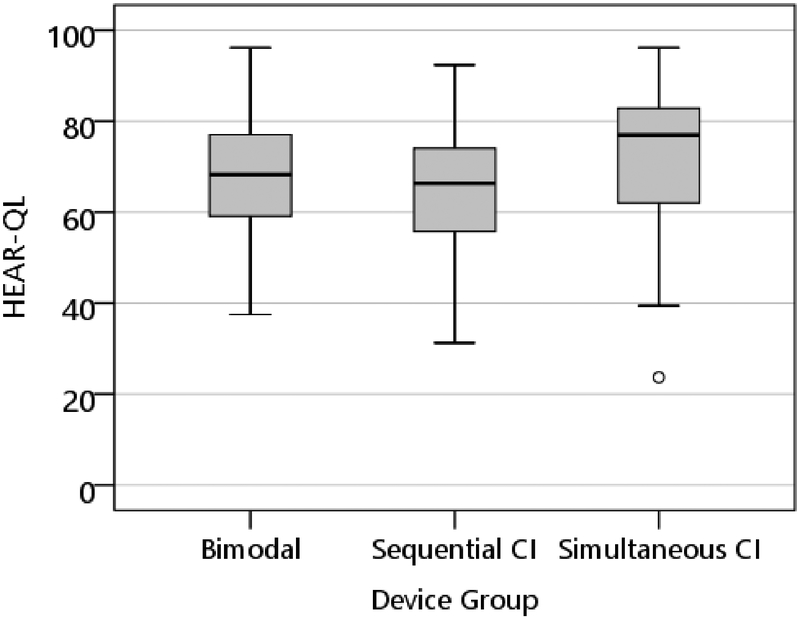
Figure 2.
Box-plots for the Total HEAR-QL scores for the Bimodal, Sequential and Simultaneous BCIs. The limits of the box represent the lower and upper quartile of the distribution and the horizontal line through the box represents the median. Open-circle outliers are values between 1.5 and 3 interquartile ranges from the end of a box.

