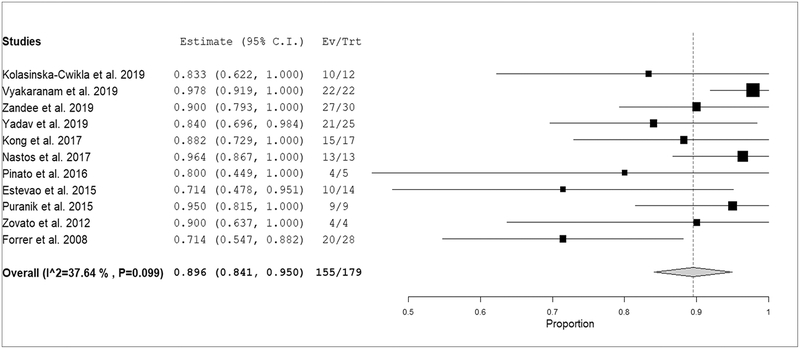
Figure 5. Proportion of PPGL patients with partial response or stable disease after PRRT.
Plots of individual studies and pooled proportion (with 95% confidence interval) of inoperable/metastatic PPGL patients with response or stable disease after PRRT (random-effects model). The size of the squares indicates the weight of each study. Mild heterogeneity among studies was evident (I-square test = 37.6%, p=0.099).

