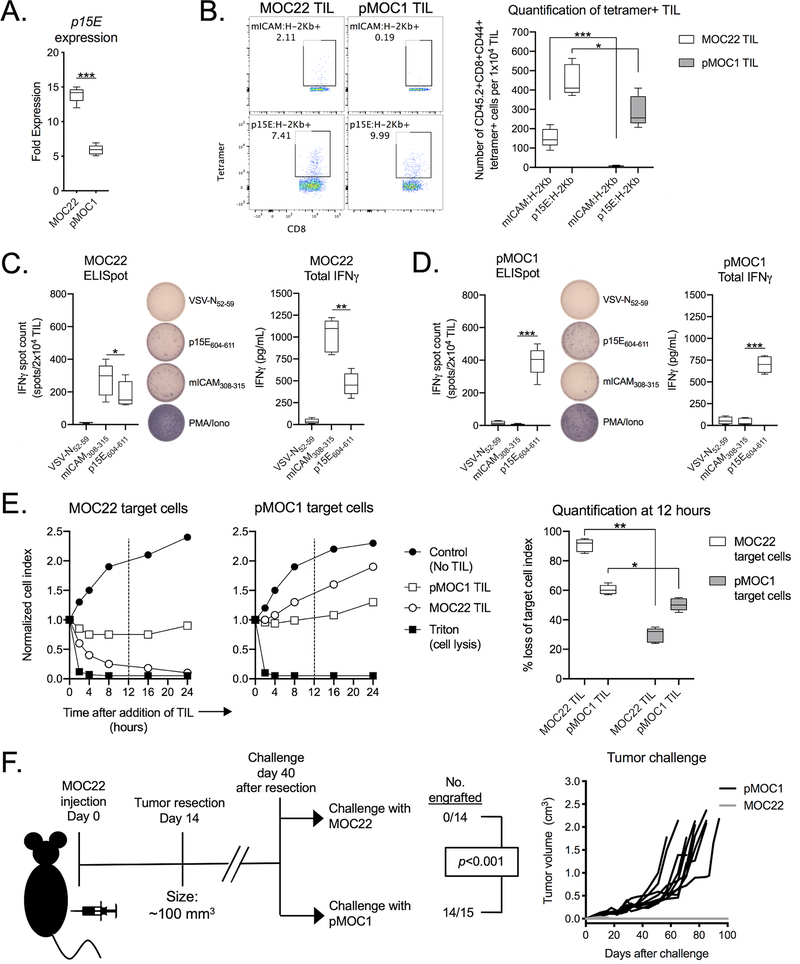
Figure 4 – Functional TIL targeting p15E failed to develop in the presence of mICAM.
A, qPCR was used to measure p15E gene expression in MOC22 and pMOC1 cells.
B, TIL were cultured from day 14 MOC22 or pMOC1 tumors. After 7 days in culture, TIL were assessed for tetramer positivity by flow cytometry. Representative dot plots are shown on the left. Quantity of tetramer positive TIL is shown on the right (n = 5 independent tumors each model).
C and D, TIL cultured from MOC22 tumors (C) or pMOC1 tumors (D) were assessed for IFNγ production upon exposure to control (VSV-N52–59) or antigenic peptides (mICAM308-315 and p15E604–611). Number of IFNγ producing cells was quantified by ELISpot (left, with representative photomicrographs of wells) and cumulative production of IFNγ was quantified by ELISA (right) (n = 5 independent tumors each model).
E, TIL cultured from day 14 MOC22 or pMOC1 tumors were co-cultured with MOC22 or pMOC1 target cells and loss of target cell viability was assessed in real-time by impedance analysis. Representative impedance plots are shown on the left. Quantification of loss of target cell index 12 hours after initiation of co-culture (vertical dashed line) is shown on the right (TIL pooled from 5 independent tumors each model).
F, MOC22 tumors were established in WT B6 mice and completely resected at day 14. 40 days after resection, mice were challenged with either MOC22 or pMOC1 cells and followed for tumor engraftment. Cumulative data from two independent experiments. Significance determined by Mantel-Cox analysis.
Unless stated otherwise, all data shown is representative data from one of at least two independent experiments.
*, p < 0.05; **, p < 0.01; ***, p < 0.001; student’s t-test

