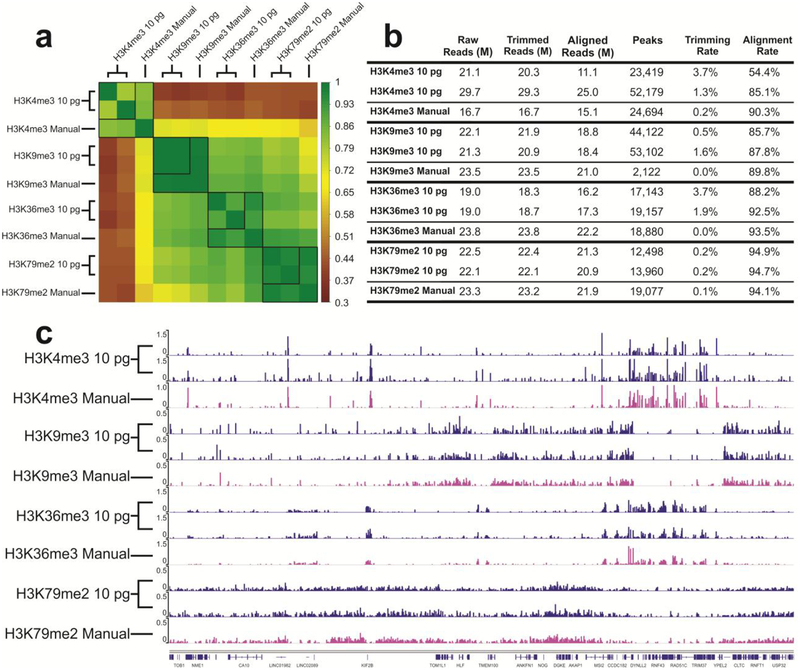
Figure 5.
Comparison of ChIP datasets of mouse prefrontal cortex samples against 4 different histone modifications (H3K4me3, H3K9me3, H3K36me3, H3K79me2). 10 pg ChIP DNA was used in each unit and 8 libraries were prepared in one run in one device. The “Manual” data on H3K9me3, H3K36me3, H3K79me2 were taken from our recently published work39. (a) Pearson correlation matrix. Signals in the promoter regions (±2 kb around TSSs) were used for computation of Pearson correlation coefficients. (b) Summary of ChIP-seq data metrics. (c) Genome browser tracks comparing microfluidic library preparation system to manual preparation for all 4 histone marks.

