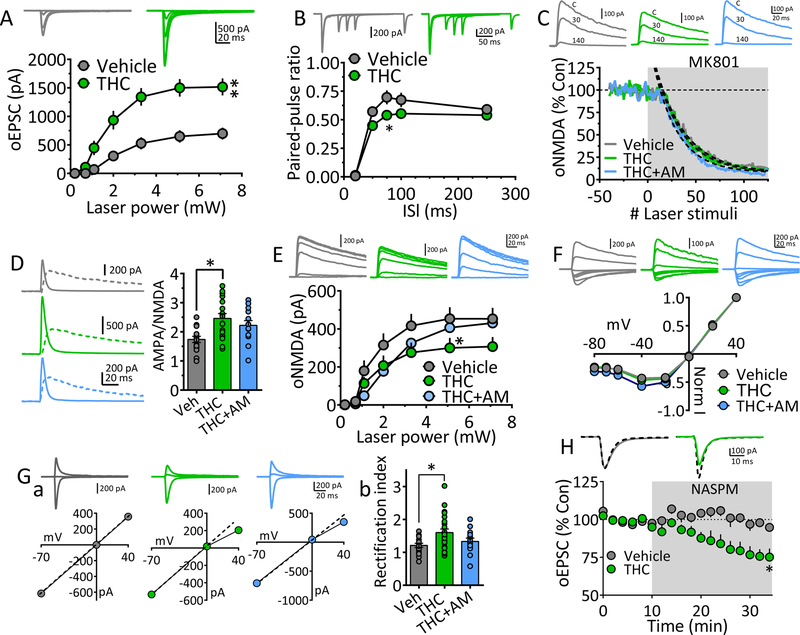
Figure 3. Mechanisms underlying strengthened vHipp glutamatergic input to NAcs following chronic Δ9-THC.
A. oEPSC I-O curves evoked by ChR2 activation of vHipp axons projecting to NAcs, after chronic vehicle or Δ9-THC injections. Representative mean oEPSCs are shown at 5 laser intensities in neurons from vehicle (gray traces) and Δ9-THC-injected (green traces) rats. The strength of vHipp glutamate input to NAcs neurons was significantly increased following chronic Δ9-THC (** = F18,336 = 5.6, p < 0.0001, intensity x treatment interaction, two-way repeated measures ANOVA). B. Mean PPR of vHipp-evoked oEPSCs at different inter-laser pulse intervals (ISI) in NAc neurons from chronic Δ9-THC- and vehicle injected rats. Mean representative traces from individual cells in both groups are shown above. The PPR was significantly decreased by chronic Δ9-THC treatment only at the 75ms ISI (* = F4,100 = 4.5, p = 0.002, ISI x treatment interaction, two-way repeated measures ANOVA, p = 0.016, Holm-Sidak post-hoc comparison). Note that paired oEPSCs overlapped at the 20 ms ISI, thereby yielding a ratio = 0. C. The rate of block of ChR2-evoked NMDA receptor oEPSCs by MK801, was not significantly altered by chronic Δ9-THC in the vHipp → NAcs pathway (time-constant of oNMDA current block by MK801: chronic vehicle = 30.7 stimuli, 95% confidence interval = 29.4 – 32.2.5 stimuli, n = 8, gray; chronic Δ9-THC = 28.8 stimuli, 95% confidence interval = 27.5 – 30.2 stimuli, n = 8, green; chronic Δ9-THC + AM251 = 25.1 stimuli, 95% confidence interval = 23.9 – 26.3 stimuli, n = 4, blue). Exponential decay time constants (τ) were obtained by best fit (dashed lines). Representative oNMDA waveforms from each group obtained before MK801 application (control, C), and at 30 and 140 stimuli are shown above. D. AMPA/NMDA ratios show potentiated transmission at vHipp → NAcs synapses. Left, representative mean waveforms of laser-evoked oEPSCs collected at −70 mV (solid line) and +40 mV (dashed line) holding potentials from chronic vehicle (gray), chronic Δ9-THC (green), or chronic Δ9-THC + AM251 (blue) groups. AMPA/NMDA = peak AMPA response at −70 mV divided by the peak NMDA response at +40 mV. Right, AMPA/NMDA ratio group means (± s.e.m.). * = p < 0.01, F3,62 = 5.28, 1-way ANOVA and Holm-Sidak post-hoc comparison). E. I-O curves of vHipp ChR2-evoked oNMDA currents in neurons from chronic vehicle, chronic Δ9-THC, and chronic Δ9-THC + AM251 treated rats. Representative mean oNMDA wave forms are shown above for each condition. oNMDA currents were significantly smaller following chronic Δ9-THC at only one laser intensity (F12,204 = 2.062, drug x power interaction, p < 0.05, 2-way repeated measures ANOVA; * = p < 0.05, Holm-Sidak’s post-hoc test). F. Lack of chronic Δ9-THC effect on the voltage-dependence of oNMDA currents. Representative mean traces from cells in chronic vehicle (gray), Δ9-THC-treated (green), and Δ9-THC + AM251 groups are shown above. G. Chronic Δ9-THC increased inward rectification of ChR2-evoked AMPA receptor oEPSCs at vHipp →NAcs synapses. Ga. Representative I-V relationships and mean AMPA oEPSCs evoked by ChR2 in the vHipp → NAcs pathway at holding potentials of −70, 0, and +40 from each of the 3 groups (chronic vehicle, gray, chronic Δ9-THC, green, and chronic Δ9-THC + AM251, blue). A hypothetical slope = 1.0 is indicated by a dashed line. Gb. Mean oEPSC RI in each group. The cells from chronic Δ9-THC-treated animals showed a significantly increased RI compared to chronic vehicle-, or chronic Δ9-THC + AM251-treated rats (F3,66 = 4.54, p < 0.01, 1-way ANOVA, * = p < 0.05, Holm-Sidak post-hoc comparison). H. Mean time course of the polyamine, GluR2-lacking AMPA receptor blocker NASPM on oEPSCs evoked by ChR2-activation of vHipp inputs to NAcs neurons. Mean wave forms shown above indicate peak effect of NASPM (solid line), compared to baseline (dashed line) in representative cells from chronic vehicle (gray) or chronic Δ9-THC-treated (green) animals. NASPM caused a significant inhibition of oEPSCs only from neurons obtained from chronic Δ9-THC-treated rats (F2,20 = 4.8, * = p < 0.05, 1-way ANOVA and Holm-Sidak’s post-hoc test). Number of neurons/Rats: A. Veh: 19/8, THC: 17/7 B. Veh: 10/8, THC: 17/7 C. Veh:7/5, THC: 4/4 D. Veh: 15/7, THC: 22/7, THC+AM: 13/4 E. Veh: 17/5, THC: 11/4, THC+AM: 10/4 Gb. Veh: 17/8, THC: 24/6, THC+AM: 13/4 H. Veh: 6/5, THC: 10/6.

