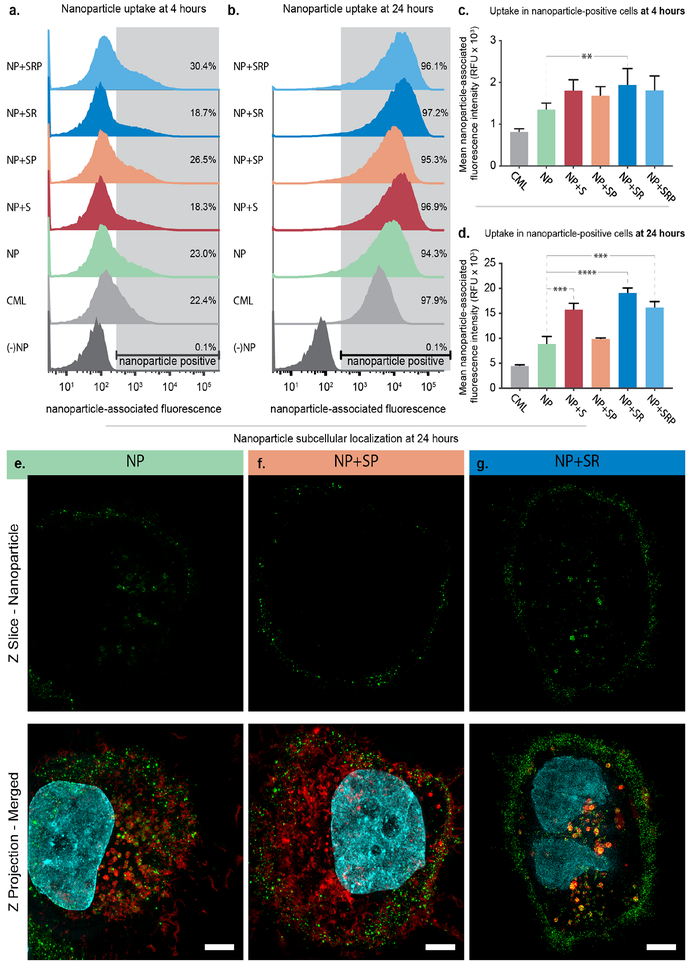
Figure 3. Addition of targeting ligands and biosensor peptides improves LbL NP binding to ovarian cancer cells.
Flow cytometry was used to assess NP-associated fluorescence of OVCAR8 cells after incubating with NPs for (a) 4 and (b) 24 hours. Analysis of the mean NP-associated fluorescence intensity of the NP-positive cell population at (c) 4 and (d) 24 hours. Error bars represent SEM, and statistical analysis was carried out using a one-way ANOVA with Tukey’s post-hoc test and an alpha of 0.05. (e) Super resolution microscopy images of OVCAR8 cells incubated with sulfoCy-3 labeled LbL NPs for 24 hours. Wheat germ agglutinin, shown in red, was used to stain endosomal membranes. NPs are shown in green and nuclei in cyan. Scale bar = 10 μm.

