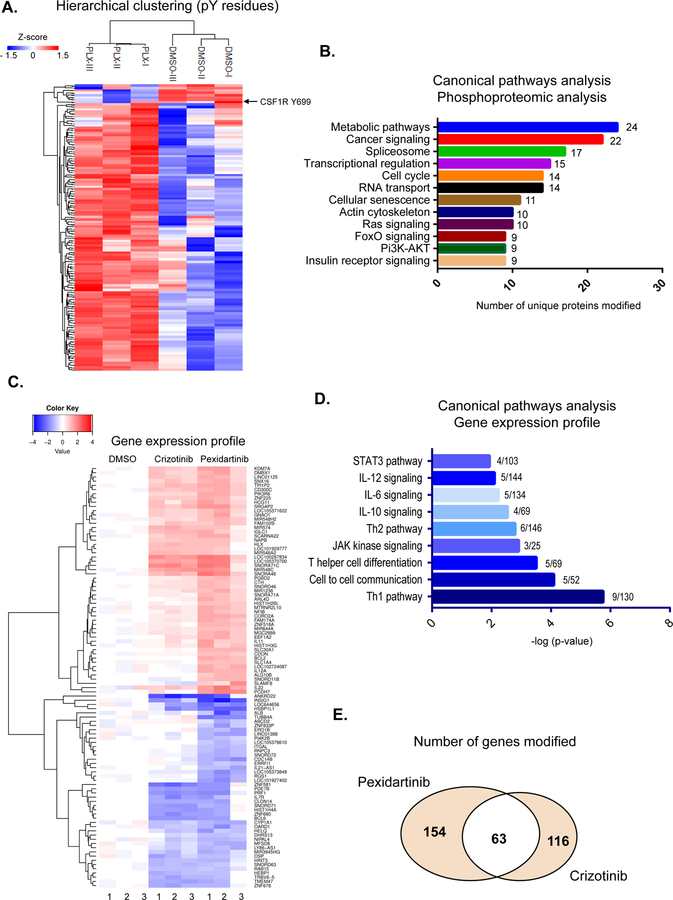
Figure 4.
Phosphoproteomic identification of CSF1R-dependent pathways. (A–B) Phosphoproteomic analysis of T-cell lymphoma lines after CSF1R inhibition with pexidartinib. A. Clustering of T-cell lymphoma lines (Karpas 299) based on the relative log2 intensities of identified phospho-tyrosine, after treatment with pexidartinib or DMSO vehicle (6hrs). Results represent three independent experiments. B. Functional analysis of the most represented canonical pathways based on the differential phosphorylation of proteins after CSF1R inhibition. (C–E) Gene expression analysis of T-cell lymphomas after CSF1R inhibition with pexidartinib (24hrs). C. Cluster analysis of T-cell lymphoma lines (Karpas 299) based on the average gene-expression after CSF1R inhibition with pexidartinib, NPM-ALK tyrosine kinase inhibition (crizotinib) or DMSO vehicle control. Results represent three independent experiments. D. Analysis of the most represented canonical pathways based on the differential gene expression downstream of CSF1R inhibition with pexidartinib E. Venn diagram depicts the number of genes for which its expression is uniquely or commonly modified by CSF1R (pexidartinib) or NPM-ALK (crizotinib) inhibition.

