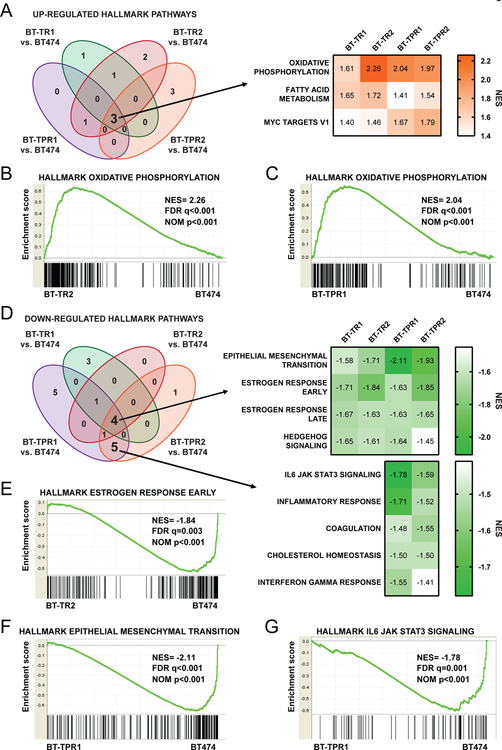
Figure 2: The oxidative phosphorylation gene program is elevated in resistant cells.
(A) GSEA hallmark pathways positively enriched with nominal p-value<0.05 and FDR q-value<0.1 in resistant pools versus BT474 parental cells (left). NES scores of each resistant pool for pathways enriched in all pools compared to BT474 cells (right). (B-C) GSEA enrichment plots of the hallmark oxidative phosphorylation pathway for BT-TR2 (B) and BT-TPR1 (C) versus BT474 parental cells. (D) GSEA hallmark pathways negatively enriched with nominal p-value<0.05 and FDR q-value<0.1 in resistant pools versus BT474 parental cells (left). NES scores of each resistant pool for pathways enriched in all pools compared to BT474 cells (right, top) or in BT-TPR pools only (right, bottom). (E) GSEA enrichment plots of the hallmark estrogen response early pathway for BT-TR2 versus BT474 parental cells. (F) GSEA enrichment plots of the hallmark epithelial mesenchymal transition pathway for BT-TPR1 versus BT474 parental cells. (G) GSEA enrichment plots of the hallmark IL6 JAK STAT3 signaling pathway for BT-TPR1 versus BT474 parental cells.

