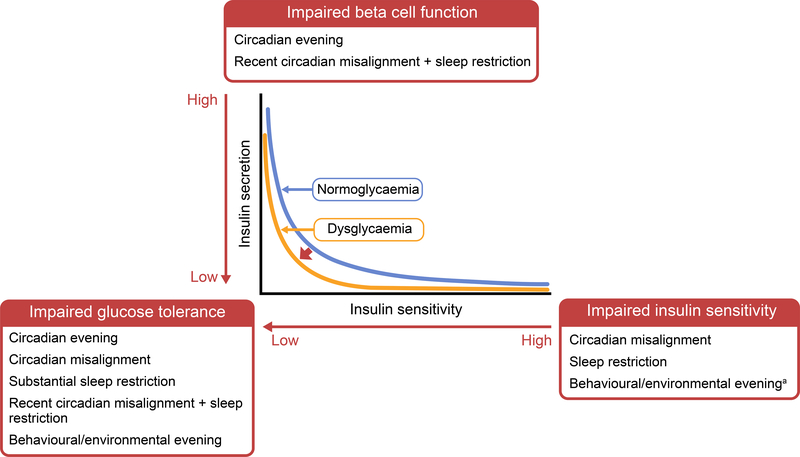
Fig. 4.
Diagram illustrating the impact of circadian and behavioural influences on glycaemic control and the potential transition to diabetes. The relationship between insulin secretion and insulin sensitivity is shown by the two hyperbolae for normoglycaemia (blue line) and dysglycaemia (orange line). When insulin sensitivity decreases, insulin secretion increases to maintain normoglycaemia (moving from right to left along the blue line). If and when insulin secretion is unable to compensate for decreased insulin sensitivity, the curve shifts to the left and impaired glucose tolerance develops (moving from right to left along the yellow line, insulin secretion does not rise sufficiently to counter the decrease in insulin sensitivity). Experimental evidence indicates that insulin sensitivity is impaired by circadian misalignment, sleep restriction and, with less strong evidencea, behavioural/environmental evening. Beta cell function is impaired by circadian evening and recent circadian misalignment with sleep restriction. Glucose tolerance has been shown to be impaired by circadian evening, circadian misalignment, substantial sleep restriction, recent circadian misalignment with sleep restriction, and behavioural/environmental evening. The circadian and behavioural impact on glycaemic control can, thus, affect the shift from normoglycaemia to dysglycaemia and the transition to diabetes. This figure is available as part of a downloadable slideset.

