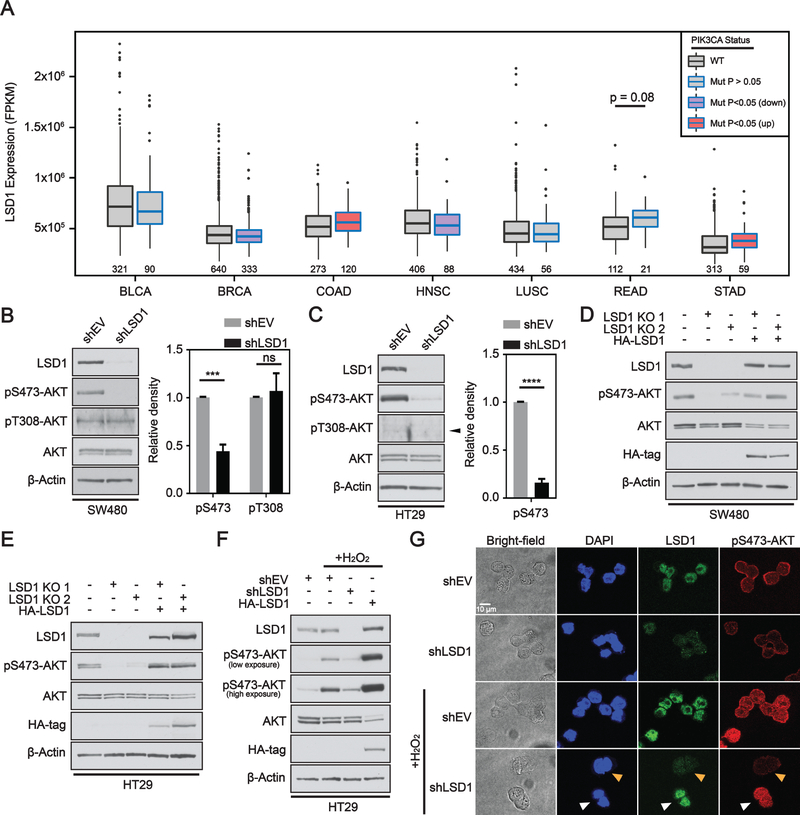
Figure 1: LSD1 regulates phosphorylation of AKT in CRC.
(A) Box and whisker plot of fragments per kilobase of transcript per million mapped reads (FPKM) expression values for LSD1 across different TCGA datasets. Box limits are set at the third and first quartile range with central line at the median, with whiskers depicting 1.5 times the interquartile range. Datapoints outside this range are represented at outliers (black dots). Black and blue outline indicates data for WT and PIK3CA mutant tumors, respectively. Red and purple fill represent significant increase and decrease in LSD1 expression, respectively, between PIK3CA mutant and PIK3CA WT tumors. The numbers under the box plots are the number of samples used to generate the plots. Western blot analysis of empty vector (shEV) or LSD1 KD in (B) SW480 or (C) HT29 cells. Arrow head indicates correct position of pT308-AKT band. Western blot quantified by densitometric analysis and normalized to β-actin and shEV. Results are represented as mean ± SD. (N=3). Significance was determined by two-tailed Student’s t-test. LSD1 CRISPR KO clones with or without LSD1 OE plasmid (HA-LSD1) in (D) SW480 or (E) HT29 cells analyzed by western blot. (F) EV, LSD1 KD or LSD1 OE cells treated w/ 250 μM H2O2 for 1H. (G) Brightfield and immunofluorescence images of EV or LSD1 KD HT29 cells under untreated or H2O2 treated conditions. A field was selected in the H2O2 treated shLSD1 cells to facilitate direct comparison of LSD1 deficient and LSD1 proficient cells. White arrow indicates cells with LSD1 expression and orange arrow indicates cells deficient in LSD1. (p-value; ***<.001, ****<.0001, ns - not significant).

