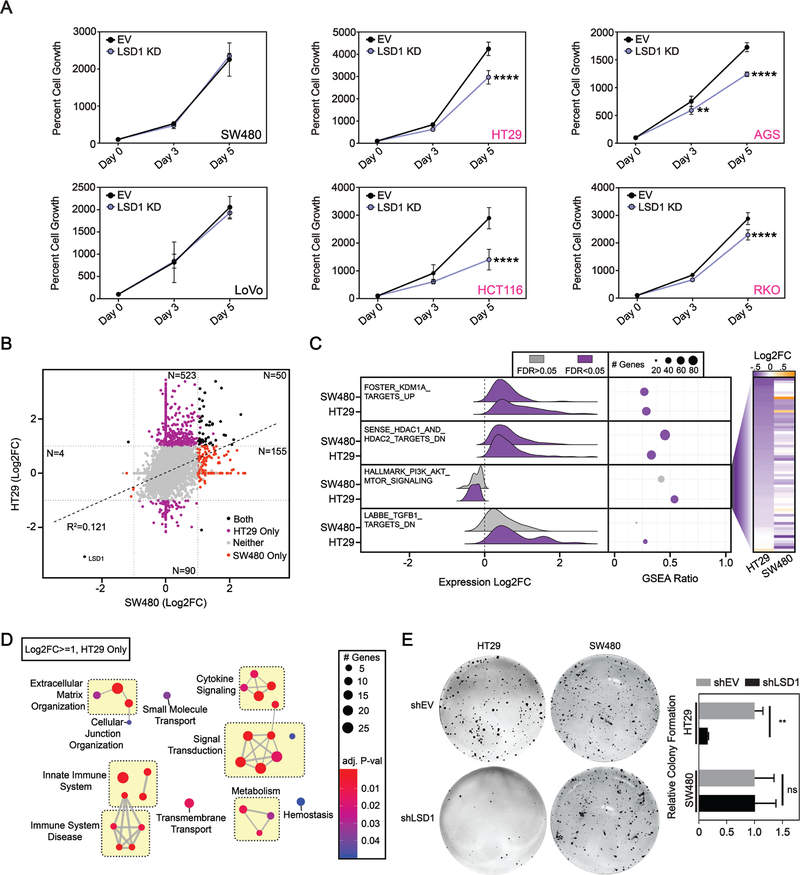
Figure 4: Gastrointestinal cell lines with mutant PIK3CA are sensitive to LSD1 KD.
(A) SW480, LoVo, HT29, AGS, HCT116 and RKO cell growth over a five-day time course determined by the CellTiter-Glo Luminescent Cell Viability Assay. N=4. Graph depicts mean + SD. Statistical analyses are performed using 2way ANOVA and Sidaks multiple comparisons test with all statistically significant comparisons shown. adj. p-value; **<.01, ****<.0001. (B) Correlation plot of RNA-seq data from LSD1 versus EV KD in SW480 and HT29 cells. Significant data points are defined as abs(Log2FC)>=1 & FDR<=0.05 for LSD1 compared to EV KD for each cell line, including those unique to HT29 (purple), unique to SW480 (red), and shared between HT29 and SW480 (black). N=3. (C) Ridge plot depicts LSD1 versus EV KD expression changes of genes contributing to max enrichment score of hallmark and curated gene sets accessed from the molecular Signatures Database (v6.2). GSEA Ratio shows the ratio of genes contributing to max enrichment score, to the total number of genes in the gene set. Heatmap on right shows Log2FC value for each gene enriched in HALLMARK_PI3K_AKT_MTOR_SIGNALING in either HT29 or SW480 cells sorted by HT29 Log2FC. (D) Network analysis of uniquely upregulated genes in HT29 after LSD1 KD with significantly enriched processes from the Reactome database. Similar terms were manually grouped, and size and color of circles were set to indicate number of genes and the p-value, respectively. (E) Clonogenic growth assay. Significance determined by 2way ANOVA with Sidak’s multiple comparisons test. N = 3. Results are represented as mean ± SD. adj. p-value; **<.01, ns – not significant.

