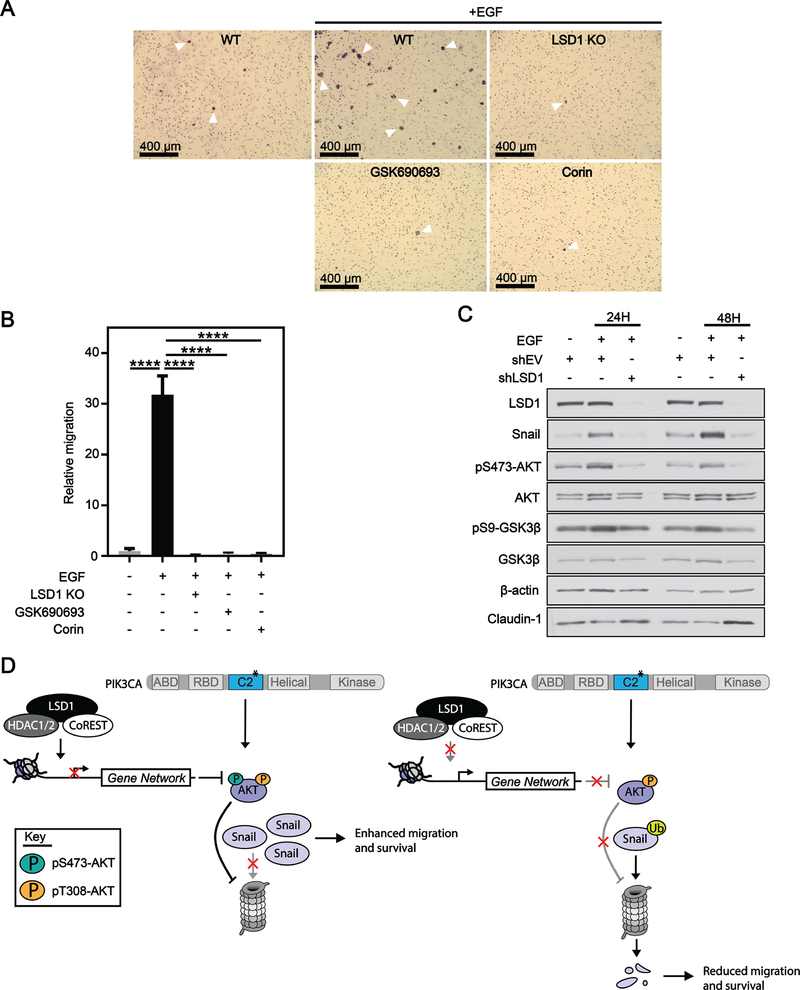
Figure 6: LSD1 is required for EGF-induced migration of cells with an active AKT-GSK3β-Snail axis.
(A) 10x bright field images of crystal violet stained HT29 cells after 48H migration through transwell insert. WT, LSD1 KO, 10 μM GSK690693 or 3 μM corin cells were co-treated with 100 ng/mL EGF for 48H. (B) Quantification of migration normalized to migration counts for untreated cells. Results are represented as mean ± SD. Significance was determined by one-way ANOVA with Tukey’s multiple comparisons test. All significant comparisons are shown. adj. p-value; ****<.0001. (C) shEV or shLSD1 cells were treated with 100 ng/mL EGF for 24H or 48H and analyzed by western blot. (D) Model depicting CoREST complex in the regulation of AKT.

