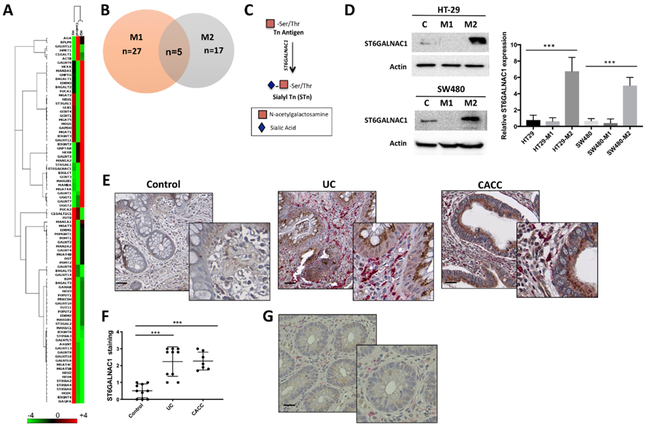
Figure 2. M2 polarized macrophages induced ST6GALNAC1 in colon cancer cells.
A) Heatmap and B) Venn diagram of eighty-four genes related to glycosylation differentially expressed in HT-29 colon cancer cells co-cultured with polarized M1 and M2 macrophages or cultured alone. C) Schematic model of Tn and s-Tn antigens. The addition of α2,6-linked sialic acid on the Tn antigen is mediated by ST6GALNAC1 and results in the biosynthesis of sTn antigen. D) Proteins isolated from HT-29 and SW-480 colon cancer cells co-cultured with M1 and M2 macrophages were immunoblotted with anti-ST6GALNAC1 Ab. Actin was used as loading control. Graph represents the relative protein expression measured by densitometry scanning of western blots. Results are representative of at least four independent experiments. E) Representative image of ST6GALNAC1 (brown) and CD163 (magenta) double staining in paraffin-embedded human colon tissues sections from non-inflamed (Control, n=9), ulcerative colitis (UC, n=10), and colitis- associated colon cancer (CACC, n=7). Scale bars, 20 μm. F) Quantification of ST6GALNAC1-positive cells in tissues sections from 6 high power fields. G) Representative image of low ST6GALNAC1 and CD163 expression in a selected area of a CACC sample. Error bars represent the SEM (D and F). P values were calculated using one-way ANOVA test. ***p<0.001 (D and F).

