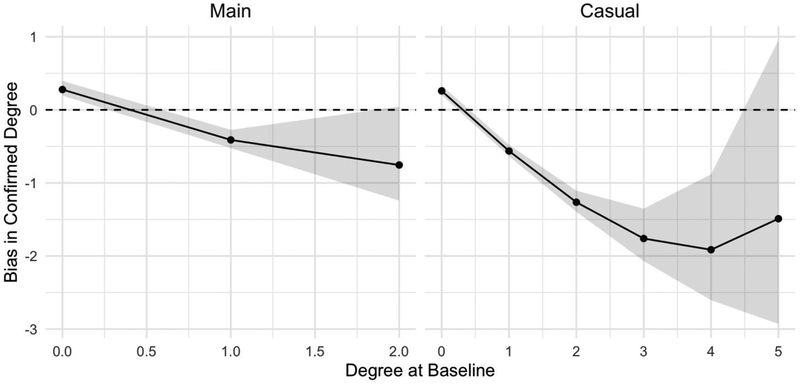
Figure.
Difference between confirmed and baseline degree as a function of baseline degree, stratified by partnership type. Dashed horizontal line at 0 displays value where there is no difference between baseline and confirmed degree. Predictions below the dashed line indicate that baseline degree overestimated confirmed degree. Lines/dots display the point estimates and grey polygons display the 95% confidence intervals around the estimates.

