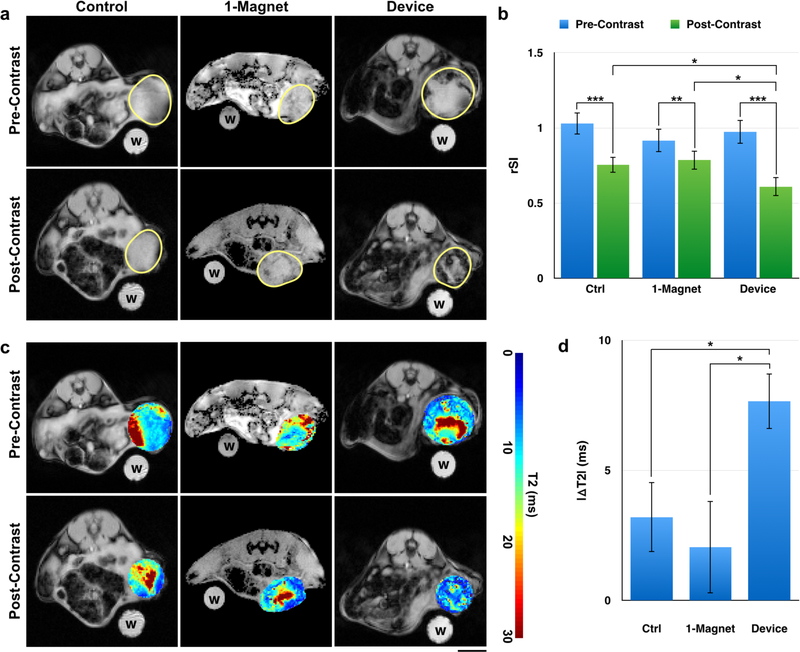
Figure 7.
The magnetic device significantly reduces T2 signal (hypointensity) from SPION micelles in tumors. (a) Pre- and post-contrast images have similar signal distributions in the control. However, mice that have been exposed to the device show much less T2 signal (hypointensity) post-contrast. Water control labeled “w”. Scale bar = 5 mm. (b) There is a significant reduction in average relative signal intensity (rSI) pre- and post-contrast in control (p < 0.001), 1-magnet (p < 0.01) and device-exposed (p < 0.001) animals, consistent with EPR. However, device animals also show a significant reduction in rSI compared to controls (p = 0.037) and 1-magnet-exposed (p = 0.026) animals post-contrast despite no difference in pre-contrast. There is no difference between control and 1-magnet rSI post-contrast. (c) T2 maps show the change in distribution of T2 times pre- and post-contrast for control and device animals. Tumors in device-exposed animals show more regions with shortened T2 times (indicating more accumulation of magnetic particles) compared to controls. (d) The change in the weighted average T2 time for each tumor slice was calculated. The shift in T2 time was significantly greater in device-exposed animals compared to control (p = 0.015) and 1-magnet-exposed (p = 0.046) animals. There is no difference between control and 1-magnet-exposed animals. N = 3 animals × 3 slices. Statistical testing used ANOVA to establish a difference between distributions, followed by pairwise t-tests.

