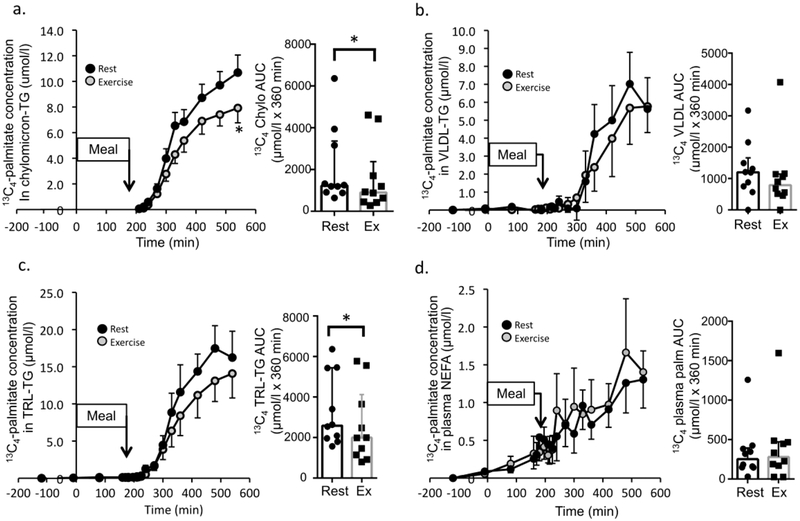
Fig. 3.
Meal-derived lipid tracer metabolism. The [13C4]palmitate concentration is shown for chylomicron-TG (a), VLDL-TG (b), TRL-TG (c) and in plasma NEFA (d) (n=10). The corresponding AUC (median ± interquartile range) for the concentration data are shown in the bar graph immediately to the right in (a–d) (n=10). ‘Meal’ indicates timing of mixed meal consumption. Time course values are mean ± SEM. * Denotes a time point significantly different between rest and exercise (time course data, repeated measures ANOVA) or a significant difference between rest and exercise for tracer concentration AUC (Wilcoxon signed-rank test) (p<0.05).

