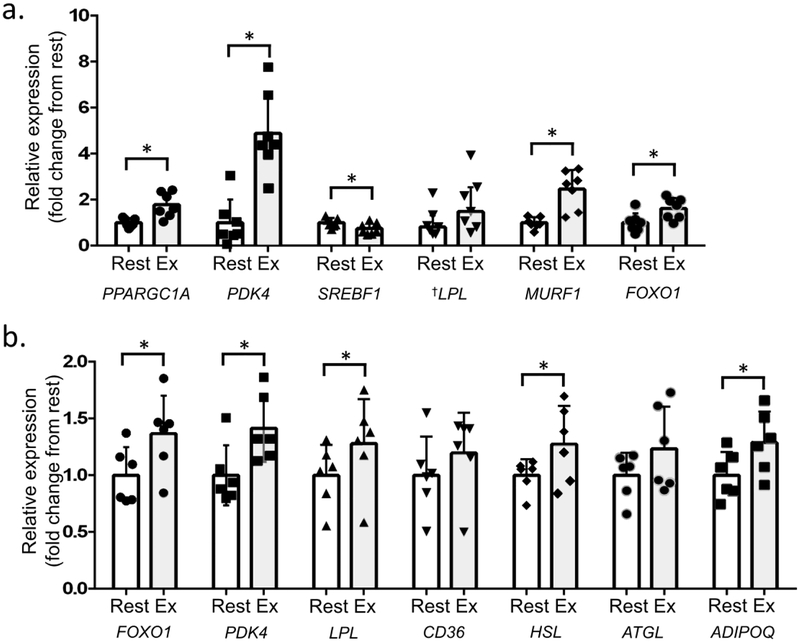
Fig. 6.
Skeletal muscle and abdominal subcutaneous adipose tissue gene expression. (a) Resistance exercise significantly increased skeletal muscle expression of PPARGC1A, PDK4, FOXO1 and MURF1, and non-significantly increased LPL gene expression. The exercise session also significantly reduced expression of SREBF1 relative to rest (n=7 for skeletal muscle gene expression). (b) Resistance exercise significantly increased adipose tissue expression of FOXO1, PDK4, LPL, HSL and ADIPOQ, but did not significantly change CD36 or ATGL expression (n=6 for all genes). Values are mean fold change above rest (mean ± SD) unless otherwise indicated. * Significant difference between rest and resistance exercise at p<0.05 for paired t tests (parametric) or Wilcoxon signed-rank tests (non-parametric). See results for corresponding p values. † Denotes use of median ± interquartile range for non-normally distributed data

