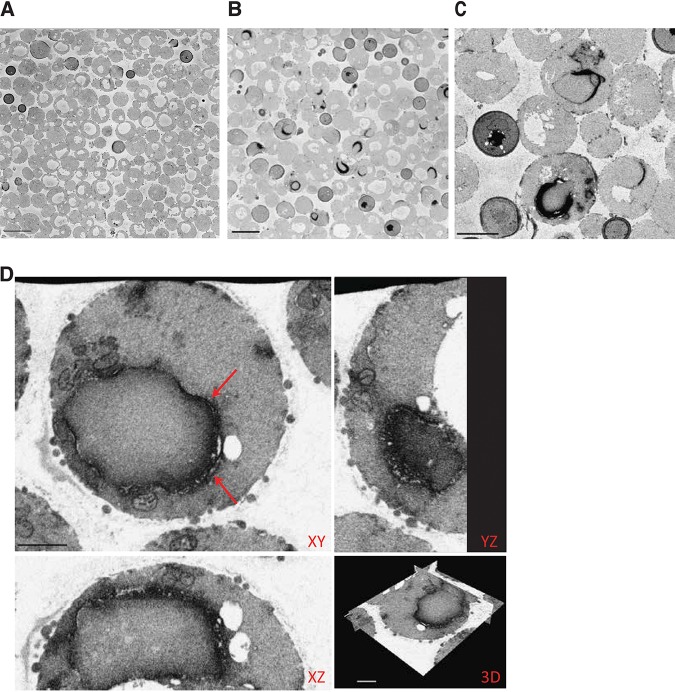
FIG 3.
SBF-SEM and FIB-SEM analysis of Erg11-APEX2 in S. cerevisiae. (A, B, and C) Visualization of multiple cells by SBF-SEM after spheroplast formation shows that compared to control spheroplast cells (A), the APEX2-tagged Erg11 electron-dense signal can be clearly observed at the ER in several cells (B and C) (scale bars, 5 μm). (D) Orthogonal views of FIB-SEM data of spheroplasts expressing Erg11-V5-APEX2 show clear localization of the Erg11 protein to the ER (scale bars, 1 μm). Aberrant ER membrane structures are indicated by red arrows.

