Figure 3.
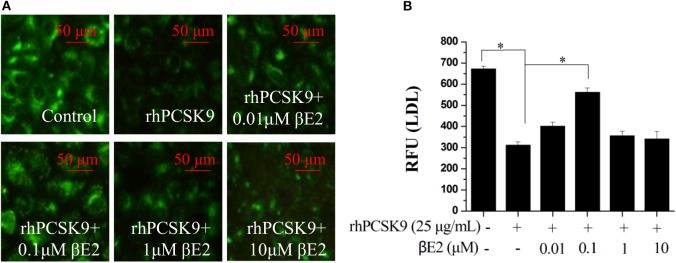
βE2 treatment for 4 h promoted LDL uptake in the presence of rhPCSK9 (25 μg/mL). (A) LDL uptake was visualized in the HepG2 cells using BODIPY-labeled LDL and detected by fluorescence microscopy as shown in the representative images. (B) BODIPY® FL fluorescence was quantified with a SpectraMax M5 reader. Values represent the means ± SEM, n = 3; *P < 0.05 for a comparison between two groups.

