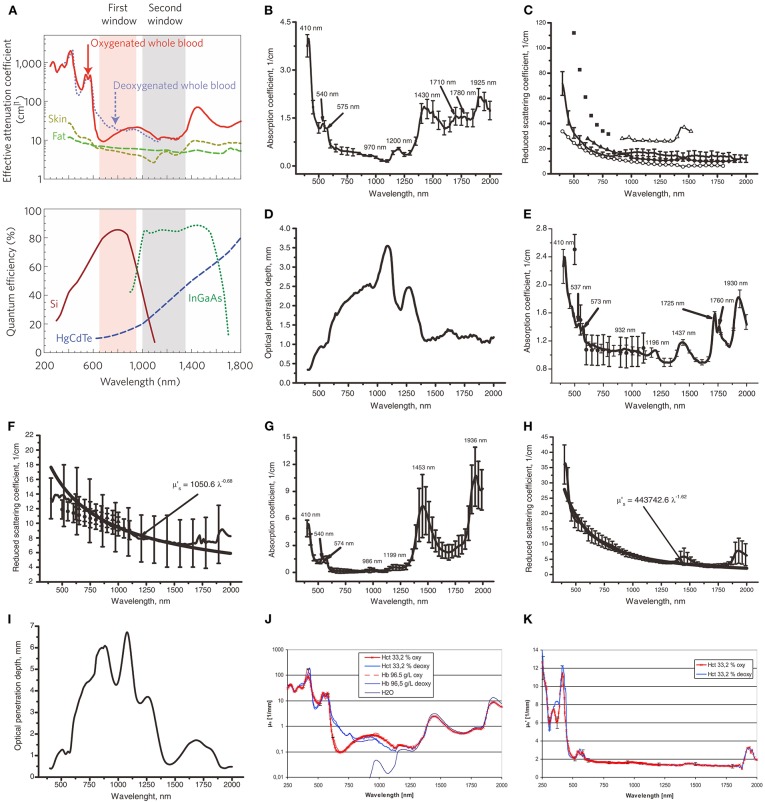
Figure 1.
Prahl et al. (1993) reported the inverse double increase (IAD) method and the power law approximation are used to process experimental data and determine the optical properties of tissues. In this figure, μ's is calculated as μ's = μs (1-g), where μs is the scattering coefficient and g is the anisotropic coefficient of scattering. The solid line corresponds to the average experimental data, and the vertical line shows the SD value. (A Top) NIR-I (first window) and NIR-II (second window) imaging windows (Smith et al., 2009). The effective attenuation coefficient represents the how easily a volume of material can be penetrated by a beam of light. (A Bottom) The sensitivity curves of the sensor in the signal detector camera with silicon (Si), indium gallium arsenic (InGaAs), and mercury telluride cadmium (HgCdTe). Unlike the charge coupled device (CCD) camera using silicon sensor, the core component of near infrared camera is semiconductor alloy sensor, including InGaAs and HgCdTe, which has a narrower band gap. In particular, InGaAs cameras exhibit high quantum efficiency when used in the NIR-II window, i.e., high sensitivity. Adapted from Smith et al. (2009) written by Smith, A.M., etc. with permission. (B,C) Show the relationship between the incident light wavelength and absorption coefficient (μa) or the reduced light scattering coefficient (μ's) in human skin in vitro, respectively. (B) Adapted from Bashkatov et al. (2005) with permission. In (C), except for the solid line, the remaining data marker points correspond to the experimental data obtained in reference (Chan et al., 1996; Simpson et al., 1998; Du et al., 2001; Troy and Thennadil, 2001; Bashkatov et al., 2005). Adapted from Chan et al. (1996), Simpson et al. (1998), Du et al. (2001), Troy and Thennadil (2001), and Bashkatov et al. (2005) with permission. (D,I) Show the penetration depth (δ) of light to skin and human mucosal tissue in the range of incident light wavelength from 400 to 2,000 nm, respectively. Adapted from Bashkatov et al. (2005) with permission. (E,F) Show the relationship between wavelength and μa or μ's in subcutaneous adipose tissue, respectively. In (E), all the data markers except the solid line correspond to the experimental data obtained in Peters et al. (1990). Adapted from Peters et al. (1990) with permission. In (F), all the data markers except the solid line correspond to the experimental data obtained in Peters et al. (1990) and Simpson et al. (1998). Adapted from Peters et al. (1990) and Simpson et al. (1998). with permission. (G,H) Show the relationship between wavelength and μa or μ's in human mucosa, respectively. Adapted from Bashkatov et al. (2005) with permission. (J) Shows the relationship between wavelength and μa for red blood cells (RBC) with or without saturated oxygen in the 33.2% hematocrit (HCT) brine solution, as well as the relationship between wavelength and μa for hemoglobin with or without saturated oxygen in the 96.5 g/dl hemoglobin solution. Adapted from Friebel et al. (2009) with permission. (J) Shows the relationship between wavelength and μ's for RBC with or without saturated oxygen in the 33.2% HCT brine solution. Adapted from Friebel et al. (2009) with permission.

