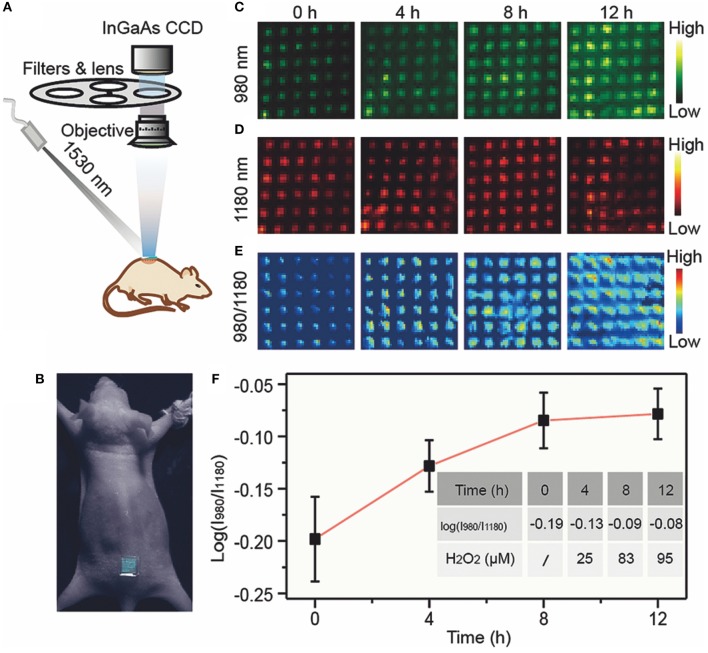
Figure 4.
Operational diagram of ratiometer fluorescence sensor (Liu et al., 2018). (A) In vivo bioimaging experimental apparatus. (B) Pictures of mice treated with microneedle patches. After lipopolysaccharide was used to induce inflammation in mice, the upconversion luminescent images of microneedle patch at 980 nm (C), 1,180 nm (D), and ratio (I980/I1180) (E) channels were detected at different times. (F) Ratiometric fluorescence (I980/I1180) of microneedle patches at different time and corresponding H2O2 concentration. Adapted from Liu et al. (2018) written by Fan Zhang etc. with permission.

