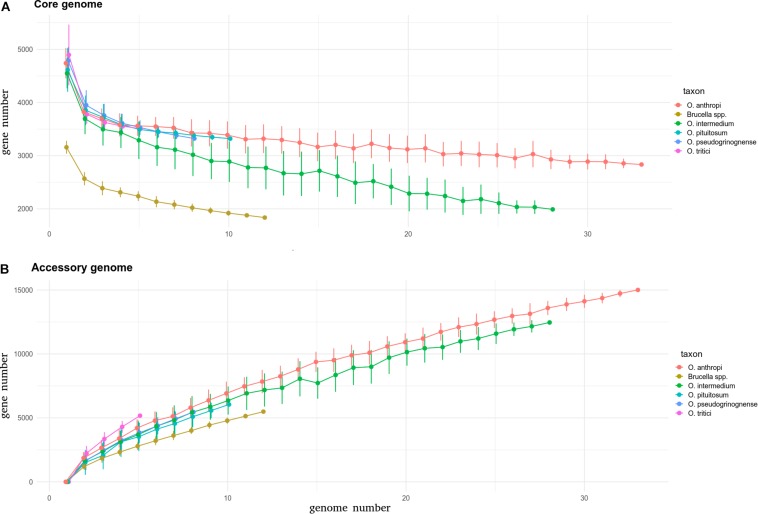
FIGURE 3.
Core (A) and accessory (B) genomes of Brucella and various Ochrobactrum species calculated using an in-house pipeline. For each species, the graph shows the number of genes in core and accessory genomes estimated for an increasing number of considered genomes, up to the number of genomes available for the taxon. The core genome is defined as the set of genes detected in all genomes under consideration. The accessory genome is defined as the total of distinct genes detected in the considered genomes (pan genome) minus the core genome. Since not all taxa have the same number of sequenced genomes, accumulation curves were produced as follows: the number of considered genomes increases from one to the total number of genomes in the taxon, and at each step, the considered genomes are selected randomly in the pool of genomes available for the taxon. This random selection was repeated up to 50 times at each step and median and standard error were estimated for core and accessory gene numbers (see section Materials and Methods).

