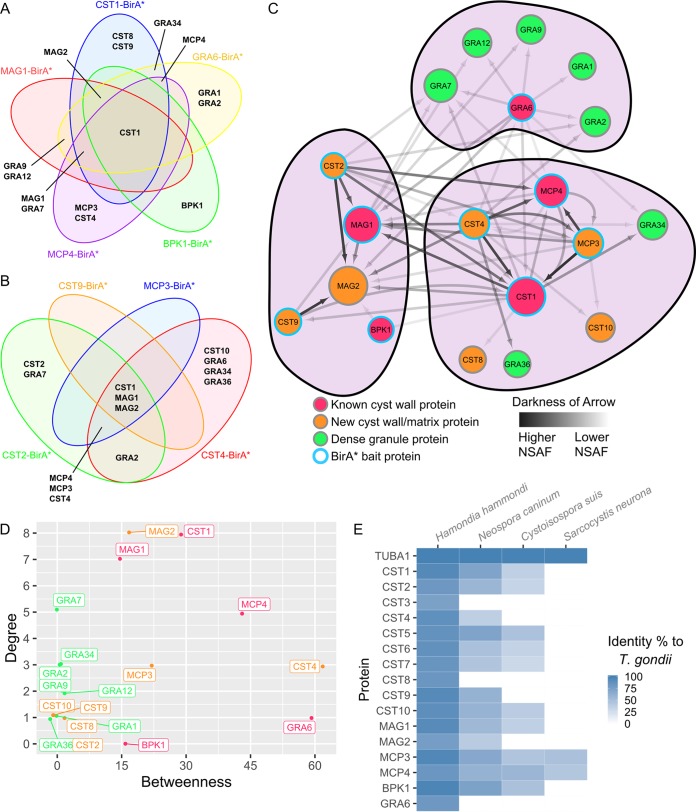
FIG 3.
Cyst wall interactome model analysis reveals distinct clusters. Venn diagrams showing the proteins that are common between the group 1 (A) or group 2 (B) cyst wall BirA* pulldowns. Each BirA* pulldown is represented by a different colored circle. (C) Network of the proteins identified in the group 1 and group 2 BirA* pulldowns. BirA* bait protein nodes are represented by a blue outline. Known cyst wall proteins, dense granule proteins, and novel cyst wall/matrix proteins are represented by red, green, and orange nodes, respectively. Darkness of arrows represents the normalized spectral abundance factor (NSAF) of the prey proteins identified in each pulldown. Size of each node represents the in-degrees or the amount of times a protein was identified within each pulldown. Protein clustering was performed using the Louvain method of community detection. (D) Graph of each node’s betweenness, which signifies the extent to which nodes stand between each other, versus their in-degrees, the frequency of each node appearing in a pulldown. (E) Heat map showing the percentage of identity between alpha tubulin and each T. gondii cyst wall and cyst matrix protein to their orthologs in other cyst-forming coccidians.

