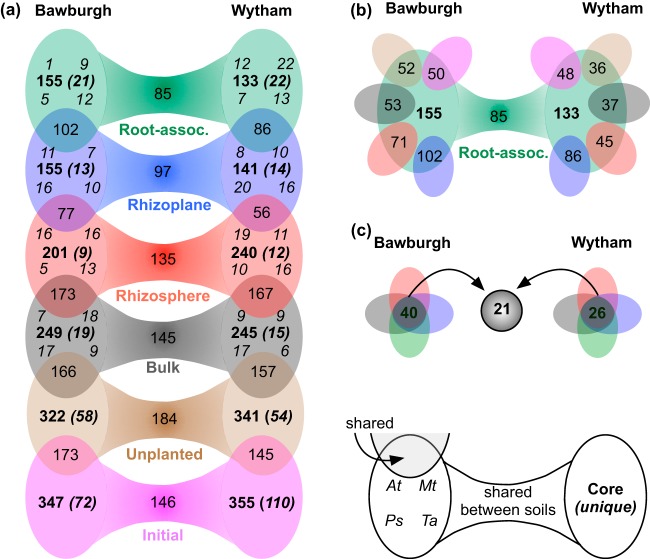
FIG 4.
Comparison of the core prokaryotic zOTUs of each plant. (a) Six fractions of four plant species grown in two soils. The core microbiota of each plant consists of common zOTUs found in at least half of the biological replicates. Each dumbbell (fraction) has two ovals for each soil. Each oval represents a number of shared zOTUs between at least 3 plant species (bold), number of zOTUs uniquely found in this fraction (bold italics), and number of zOTUs that are plant species specific (indicated around oval edges; top left, A. thaliana [At]; top right, M. truncatula [Mt]; bottom left, P. sativum [Ps]; and bottom right, T. aestivum [Ta]). The connecting bridges between the ovals indicate the number of zOTUs shared between soils for each fraction, while the overlapping regions between dumbbell ovals indicate a number of zOTUs shared between fractions. (b) For the root-associated (root-assoc.) fraction, the numbers of shared zOTUs with the initial soil, unplanted soil, bulk soil, rhizosphere, and rhizoplane are indicated within smaller ovals around the main graph using the corresponding color scheme. (c) Number of zOTUs that are found in all the fractions (bulk, rhizosphere, rhizoplane, and root associated) for each soil. The number in the middle represents the number of zOTUs that are shared between two soils. The numbers of plant replicates in Bawburgh and Wytham soils (respectively) are as follows: initial, 18 and 23; unplanted, 8 and 7; bulk soil, 8 and 7 (At), 8 and 7 (Mt), 8 and 5 (Ps), and 6 and 8 (Ta); rhizosphere, 7 and 5 (At), 5 and 6 (Mt), 7 and 5 (Ps), and 7 and 8 (Ta); rhizoplane; 5 and 3 (At), 5 and 6 (Mt), 6 and 3 (Ps), and 6 and 5 (Ta); root associated, 6 and 5 (At), 6 and 8 (Mt) 6 and 6 (Ps), and 6 and 4 (Ta). Bar graphs presenting community abundance and taxonomic profile for each of the zOTU groups can be found in Fig. S4.

