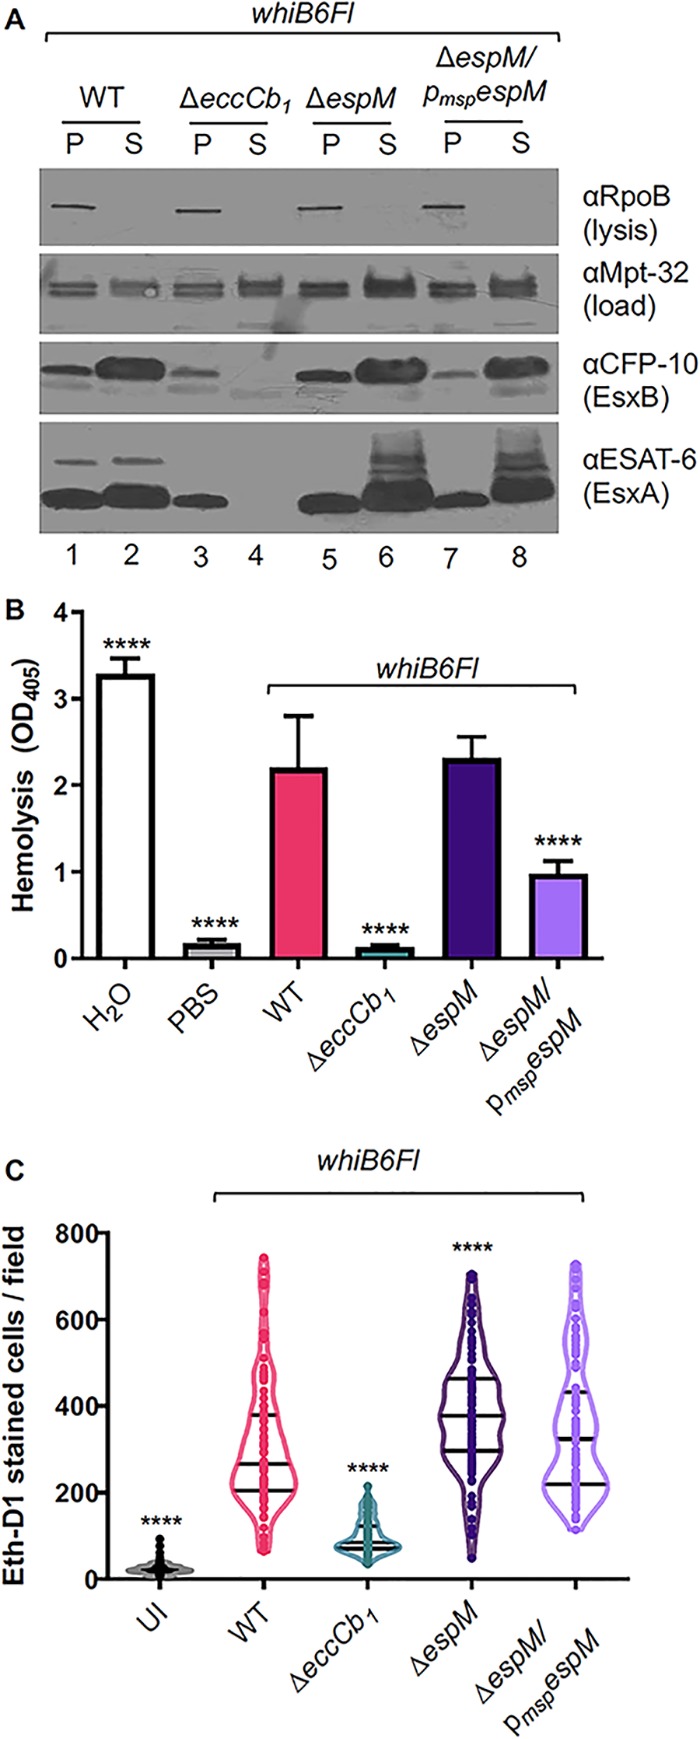
FIG 5.

EspM fine-tunes ESX-1 function. (A) Western blot analysis of EsxA and EsxB secretion in vitro. 10 μg of protein was loaded per lane and resolved on a 4% to 20% gel. RpoB was used as the lysis control; Mpt-32 is a Sec-dependent secreted protein that served as a loading control. The image shown is representative of three biological replicates. (B) Hemolysis assay of M. marinum strains. The image shown represents at least three biological replicates, each performed in technical triplicate. Error bars represent the propagated errors. A one-way ordinary ANOVA (P < 0.0001) followed by a Tukey’s multiple-comparison test was performed. ****, P < 0.0001 (relative to the WT strain). OD405, optical density at 405 nm. (C) Cytolysis assay of RAW 264.7 cells following 24 h of infection with M. marinum at an MOI of 7. Black bars indicate median and quartiles. UI, uninfected. Statistical analysis was performed using a one-way ordinary ANOVA (P < 0.0001) followed by a Tukey’s multiple-comparison test. ****, P < 0.0001 (compared to the WT strain). Each dot represents the number of EthD-1-stained cells in a single field. A total of 10 fields were counted using ImageJ for each well. Processing of 3 wells was performed for each biological replicate. A total of 90 fields were counted for each strain.
