FIG 7.
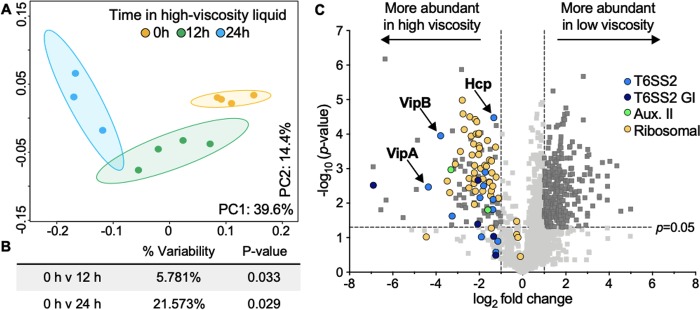
T6SS2 proteins are more abundant in high-viscosity liquid than in low-viscosity liquid. (A) Principal-coordinate analysis (PCoA) plots of proteomics data. The percentages on each axis indicate the amount of variation explained by the axis, and ellipses indicate 95% confidence intervals. (B) Adonis P values for pairwise comparisons between each treatment. (C) Volcano plot showing the log2 fold difference in protein abundance between 0 h and 24 h in high-viscosity treatments. Proteins with a negative log2 fold change value are more abundant in the high-viscosity treatment (left), and proteins with a positive log2 fold change value are more abundant in the low-viscosity treatment (right). Colors indicate the functional assignment of the proteins of interest: light blue, T6SS2 proteins; dark blue, proteins on the T6SS2 genomic island (GI); green, proteins encoded by T6SS auxiliary cluster II (Aux. II); yellow, ribosomal proteins. Data points above the dashed horizontal line had significant P values between treatments (Student's t test with the Bonferroni correction, P < 0.05), and those outside the vertical dashed lines had a magnitude fold change of >|1| log2 between treatments (dark gray squares).

