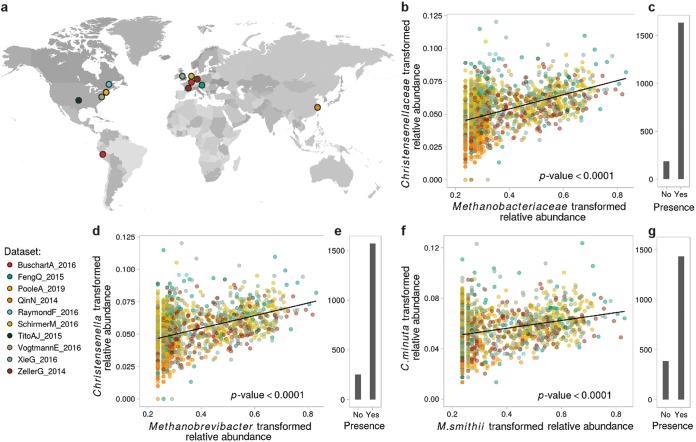
FIG 1.
Abundances of the Methanobacteriaceae and Christensenellaceae families across populations. (a) Countries where the human gut metagenomes used in our meta-analysis (n = 1,821 samples) were recruited by 10 independent studies (summarized in Table S3); (b) association between the transformed relative abundances of Christensenellaceae and Methanobacteriaceae in samples where the a member of the Methanobacteriaceae was detected; (c) numbers of samples in which the Methanobacteriaceae were detected; (d and e and f and g) same as panels b and c at the genus and species levels, respectively. The correlation between the transformed relative abundances of both taxa at each taxonomic level was evaluated using linear mixed models to correct for covariates (ANOVA, P values < 0.0001).

