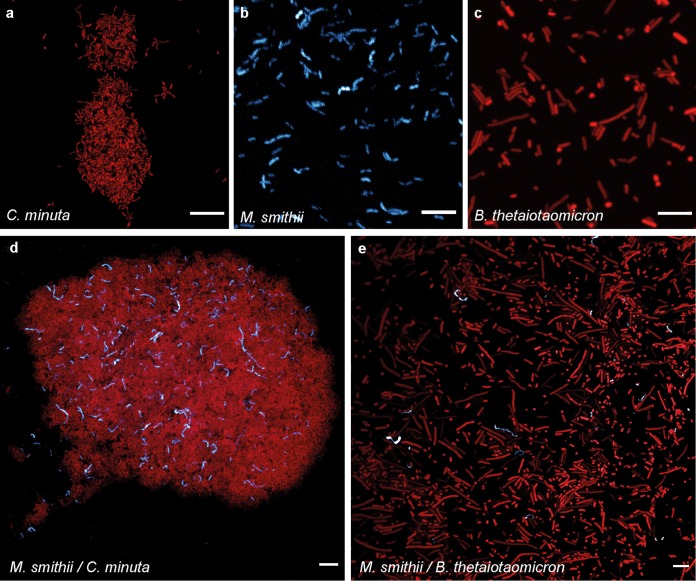
FIG 2.
Confocal micrographs of the cultures after 3 days of growth. (a) C. minuta alone; (b) M. smithii alone; (c) B. thetaiotaomicron alone; (d) M. smithii and C. minuta together; (e) M. smithii and B. thetaiotaomicron together. SYBR green I fluorescence (DNA staining) is shown in red, and M. smithii’s coenzyme F420 autofluorescence is shown in blue. Scale bars represent 10 μm. Based on gas production, at 3 days of growth, B. thetaiotaomicron was already at stationary phase (explaining the elongated cells) (see Fig. S2 for confocal micrographs of B. thetaiotaomicron and M. smithii at 2 days of growth), C. minuta was at the end of the exponential phase, and M. smithii was still in exponential phase.

