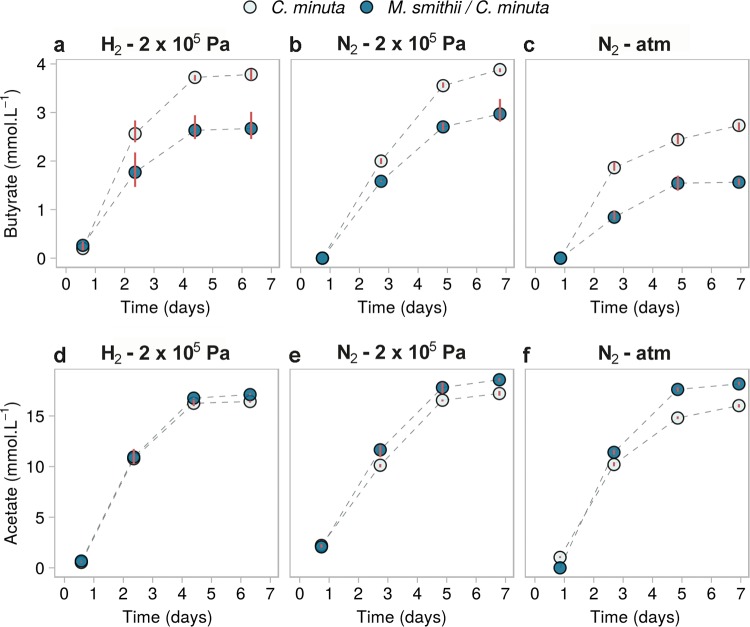
FIG 6.
SCFA concentrations over time in mono- and cocultures of C. minuta and M. smithii grown under different conditions and in cultures from batches 1 to 3 (Table S1). (a to c) Butyrate concentrations; (d to f) acetate concentrations. Only these SCFAs were detected among the fatty acids tested (fatty acids from C1 to C8, iso-valerate, and iso-butyrate). Points represent the averages of results from 3 biological replicates for each condition, and red bars join the minimal and maximal values. Monocultures of M. smithii are not shown, as they did not differ from the blanks (negative controls).

