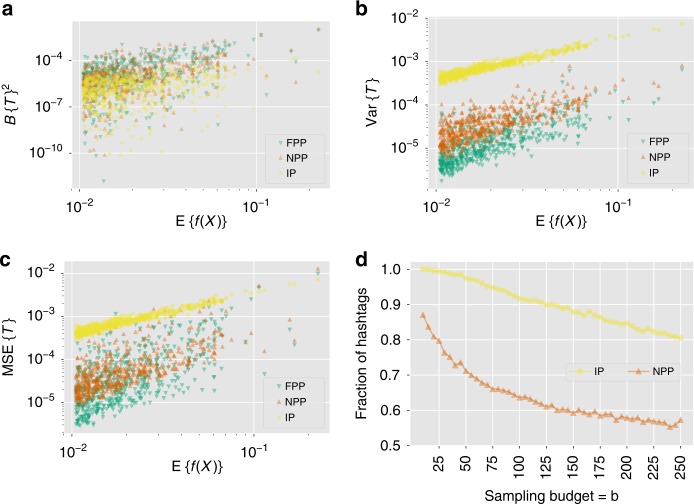
Fig. 4. Comparison of estimates of the prevalence of Twitter hashtags produced by the polling algorithms.
Variation of a squared bias (Bias{T}2), b variance (Var{T}), and c mean squared error (Bias{T}2 + Var{T}) of the polling estimate T as a function of a hashtag's global prevalence . Each point represents a different hashtag and a fixed sampling budget b = 25. The polling algorithms used are intent polling (IP), node perception polling (NPP) and the proposed follower perception polling (FPP). d Fraction of hashtags for which the FPP algorithm outperforms the other two in terms of MSE. The fraction for NPP approaches 0.5, and for IP approaches 0.8 as sampling budget b increases. These figures illustrate that the proposed FPP algorithm achieves a bias-variance trade-off by coupling perception polling with friendship paradox to reduce the mean squared error.

