
Figure 2.
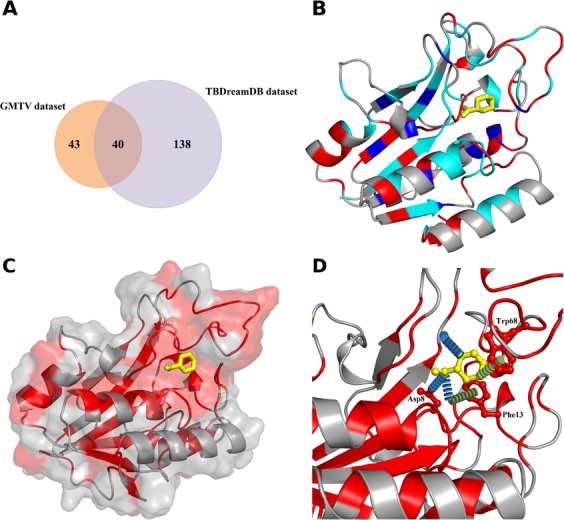
Distribution of clinical resistant and susceptible mutations in PncA. (A) Venn diagram representing the distribution of clinical mutations in the different datasets used to build the predictive model. (B) Clinical resistant and susceptible mutations mapped on the crystal structure. Amino acid positions where both susceptible and resistant mutations were seen are colored in cyan and emphasizes the need for a better and improved tool to classify them accurately. (C) Surface view of PncA with the docked PZA (yellow, ball and stick representation). Clinical resistant mutations, shown in red, are not just located at the PZA binding site, but are spread equally throughout the whole protein. (D) Molecular interactions between PZA (yellow sticks) and the surrounding amino acids which are part of the catalytic triad (Asp8) and substrate binding site (Trp68, Phe13). Hydrogen bonds are shown as blue dashes, and π-interactions as green dashes.