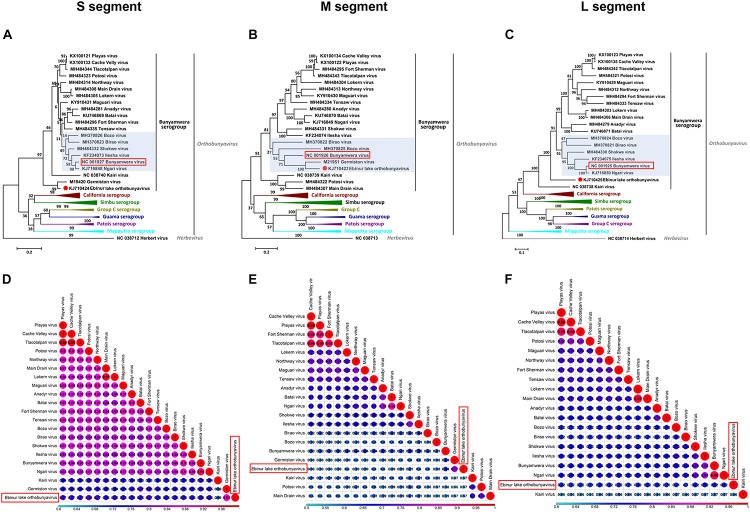
FIGURE 2.
Maximum likelihood phylogenetic trees (A–C) and pairwise distance (D–F) based on alignments of nucleotide sequences of orthobunyaviruses. The scale bar indicates the evolutionary distance in the number of substitutions per nucleotide substitution/site, and the principal bootstrap support levels are indicated. Branches are color coded according to group. The Herbert virus was used as an outgroup in the ML trees.

