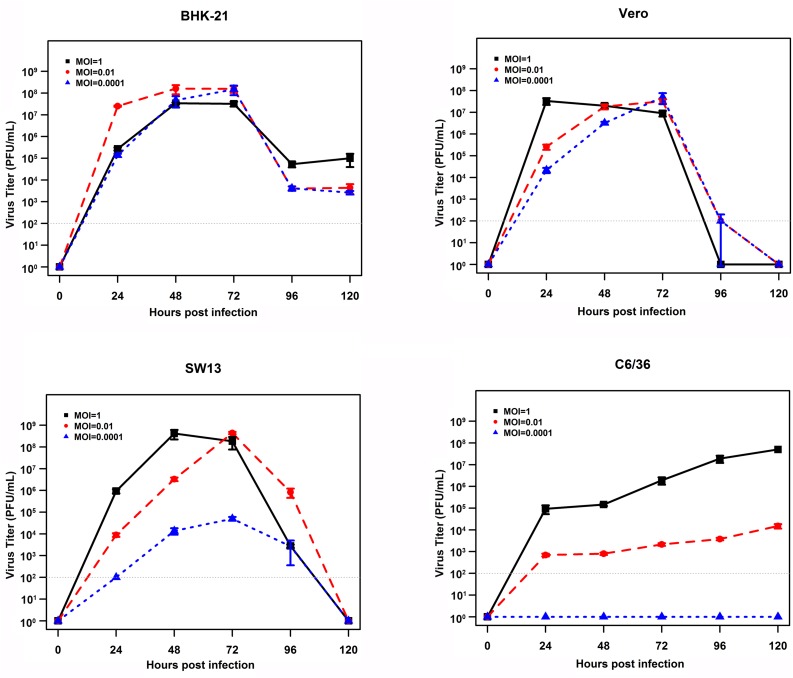
FIGURE 4.
Growth curves of EBIV (MOI = 1, 0.01, and 0.0001) in cells derived from mammals and mosquitoes. A significant difference in the highest virus titers was only observed between C6/36 and BHK cells (C6/36 vs. BHK with P < 0.01, SW13 vs. BHK with P = 0.02, Vero vs. BHK with P = 0.03, SW13 vs. Vero with P = 0.99, C6/36 vs. SW13 with P = 0.66, and C6/36 vs. Vero with P = 0.55).

