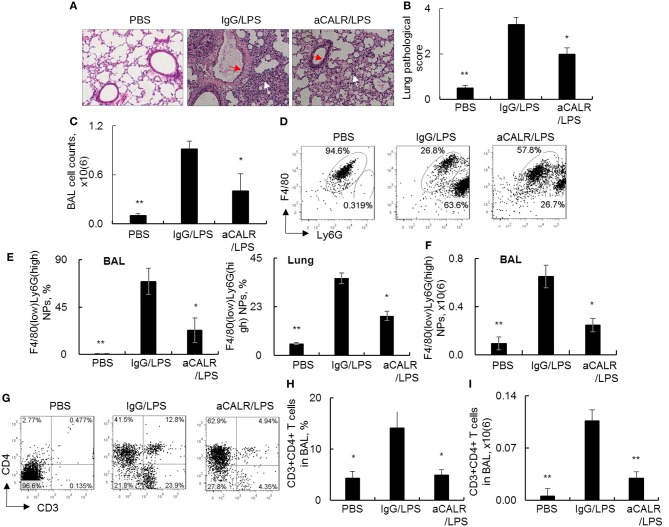
Figure 3.
aCALR suppressed infiltration of neutrophils and T lymphocytes into the lungs of mice with ALI. C57BL/6 mice were intraperitoneal (i.p.) injected with 14 μg/kg aCALR, in conjunction with intratracheal (i.t.) injection with 5 mg/kg LPS (aCALR/LPS group). The mice injected with PBS alone (PBS group), IgG plus LPS (IgG/LPS group) were control groups. BAL and lung tissues were collected 2 days after treatment. (A) H&E staining for lung histology. Red arrow indicates epithelial cell hyperplasia and white arrow indicates inflammatory infiltrates. One representative photograph of each group. (B) Quantitative analysis of ALI severity by scale from 0 to 4 in terms of infiltrating inflammatory cells and alveoli destruction. (C) Total cell counts in BAL. (D) Flow cytometry analysis of neutrophils (NPs) and macrophages (MPs) in BAL. NPs were identified as F4/80(low)Ly6G(high) cells and MPs were identified as F4/80(high)Ly6G(low) cells. One representative dot plot of each group was shown. (E) Statistical analysis of the percentage of NPs in BAL (left panel) and lung digests (right panel). (F) Absolute number of NPs in BAL. (G) flow cytometry analysis for CD3+CD4+T lymphocytes in BAL. Quantitative analysis of the percentage (H) and absolute number (I) of CD3+CD4+ T cells in BAL. n = 5 mice/group for all quantitative analysis. Data was presented as mean ± standard error. *p < 0.05 and **p < 0.01 vs. IgG/LPS group.

