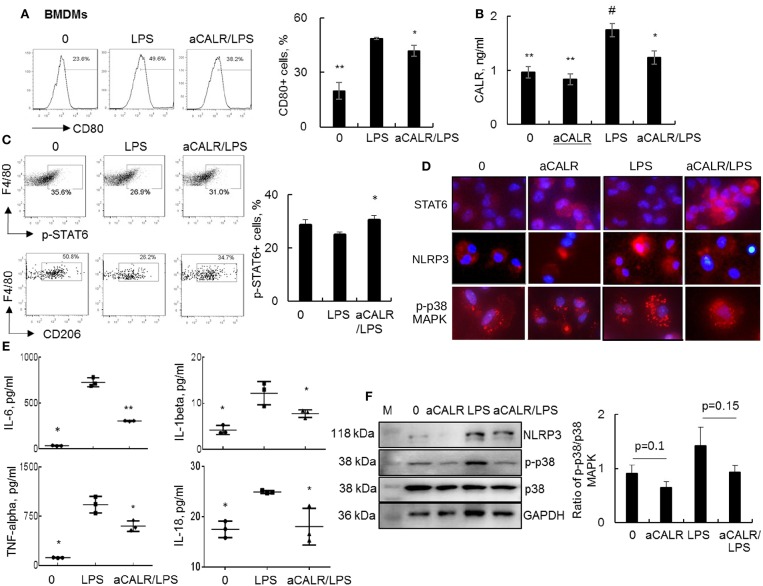
Figure 7.
aCALR suppressed the expression of CALR and pro-inflammatory cytokines in LPS-treated BMDMs. BMDMs were treated with 500 ng/ml LPS with or without 30 min pre-treatment of 1 μg/ml aCALR. The cells untreated or treated with aCALR and LPS alone were controls. (A) Twenty-four hours after treatment, CD80 expression on F4/80+CD11b+ macrophages were quantitatively analyzed by flow cytometry analysis. The percentage of CD80+ macrophages was presented as histogram (left panel) and quantitatively analyzed (right panel). *p < 0.05, **p < 0.01 vs. LPS group, n = 3. (B) The expression level of CALR in supernatants of the treated cells was analyzed by Sandwich ELISA assay. #p < 0.05, vs. the untreated cells; *p < 0.05, **p < 0.01 vs. LPS-treated cells, n = 3. (C) Flow cytometry analysis for p-STAT6 and CD206 on F4/80+CD11b+ macrophages. One representative data of three independent experiments. The percentage of p-STAT6+ cells were quantitatively analyzed (right panel). *p < 0.05 vs. LPS-treated cells, n = 3. (D) Immunostaining for the expression of STAT6, NLRP3, and p-p38 MAPK in BMDMs. Positively stained cells (red) were visualized under fluorescence microscope after incubation with Cy3-conjugated anti-rabbit IgG. Nuclei were stained with DAPI (blue). One representative photograph was shown for each treatment (magnification 400×). (E) ELISA analysis for IL-6, IL-1beta, TNF-alpha, and IL-18 in supernatants of the treated cells. *p < 0.05, **p < 0.01 vs. LPS-treated cells. (F) Western blot analysis for NLRP3, p-p38 MAPK and total p38 MAPK. Blots incubated with antibody against GAPDH were used as internal controls. M indicates protein marker and one representative blot of three independent experiments (left panel). Quantitative analysis of band intensity by Image J software (right panel). Data was presented as the ratio of target protein over internal control GAPDH and statistically analyzed by 2-tail student t-test.

