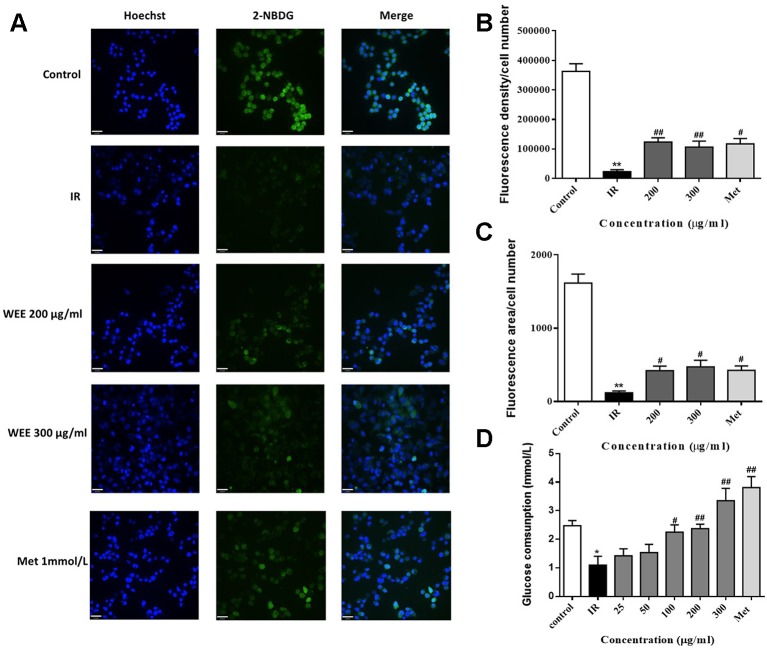
Figure 3.
WEE elevated the glucose uptake and consumption in PA-induced HepG2 cells HepG2 cells were incubated with normal glucose (5.5 mM) or high glucose (30 mM) in the absence or presence of WEE (200 and 300 μg/ml) or metformin (165 μg/ml) for 24 h and incubated with insulin (100 nM) for another 30 min. The glucose uptake was then detected by 2-NDBG assay, and the nuclear was stained by Hoechst (A). The fluorescence intensity and area were analyzed using Image J software assays (B, C). After 24 h treatment followed by incubation with insulin (100 nM) for 30 min, cells were incubated with RPMI-1640 containing 11.1 mmol/L glucose for 24 h. The glucose contents in the culture medium were determined by glucose assay kit (D). Data presented in bar charts are mean ± SEM values from six independent experiments. Groups are significantly different from the control group at *p < 0.05, **p < 0.01. The groups are significantly different from the IR group at #p < 0.05 and ##p < 0.01 determined by Dunnett’s multiple comparisons test. The bar in each photograph indicates 33 μm.

