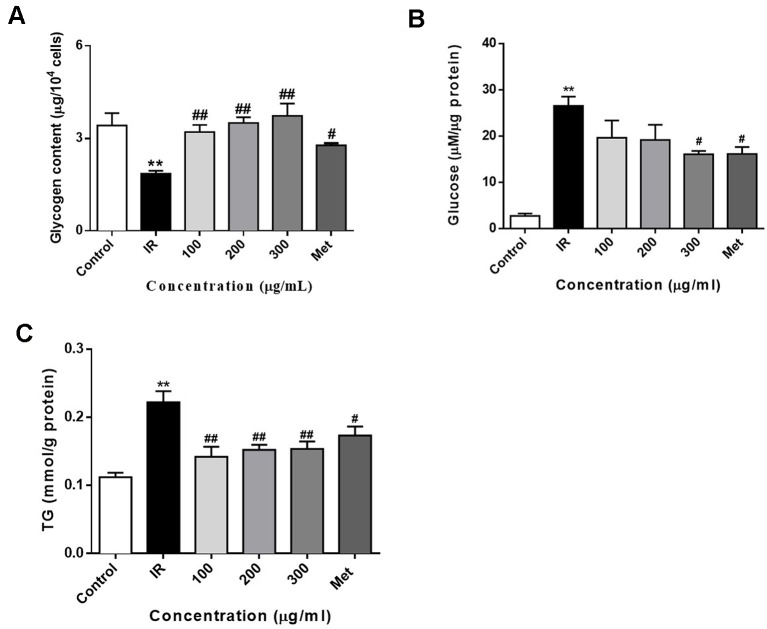
Figure 4.
WEE treatment increased the glycogen contents and decreased the glucose production and TG content in PA treated HepG2 cells. HepG2 cells were incubated with normal glucose (5.5 mM) or high glucose (30 mM) plus PA (0.3 mM) in the absence or presence of WEE (100–300 μg/ml) or metformin (165 μg/ml) for 24 h and followed by insulin (100 nM) incubation for 20 min. The intracellular glycogen content was detected by the sulfuric acid-anthrone colorimetric method (A). The glucose production in the culture medium (glucose- and phenol red-free DMEM containing gluconeogenic substrates) was determined by glucose oxidase method (B). The intracellular TG content was measured by enzymic method (C). Data presented in bar charts are mean ± SEM values from six independent experiments. Groups are significantly different from the control group at **p < 0.01. The groups are significantly different from the IR group at #p < 0.05 and ##p < 0.01 determined by Dunnett’s multiple comparisons test.

