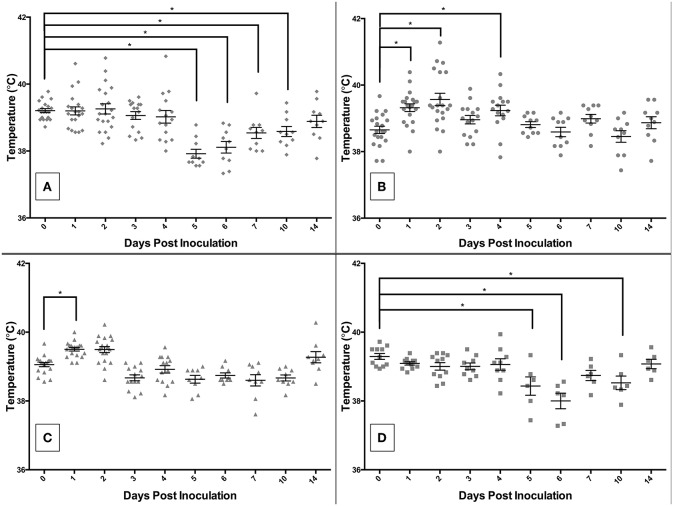
Figure 4.
Comparison of rectal temperatures of pigs inoculated with Salmonella serovars 4,[5],12:i:- (A), Typhimurium (B), and Derby (C), and non-inoculated control (D) pigs in animal study #2. Asterisks represent significant differences from the mean temperature on DPI 0 (p < 0.05). Each datum point represents the temperature in individual animal; short horizontal bar represents mean temperature within a group.

