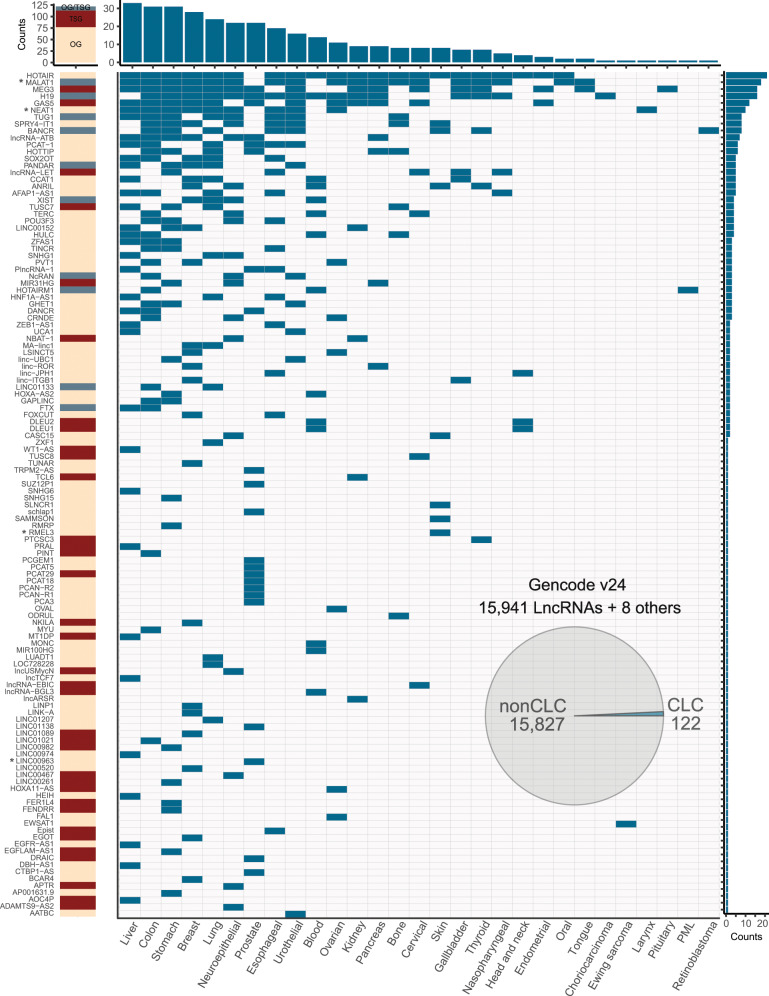
Fig. 1. Overview of the Cancer LncRNA Census.
Rows represent the 122 CLC genes, columns represent 29 cancer types. Asterisks next to gene names indicate that they are predicted as drivers by PCAWG, based either on gene or promoter evidence (see Supplementary Data 1). Blue cells indicate evidence for the involvement of a given lncRNA in that cancer type. Left column indicates functional classification: tumour suppressor (TSG), oncogene (OG) or both (OG/TSG). Above and to the right, barplots indicate the total counts of each column/row. The piechart shows the fraction that CLC represents within GENCODE v24 lncRNAs. Note that 8 CLC genes are classified as “pseudogenes” by GENCODE. “nonCLC” refers to all other GENCODE-annotated lncRNAs, which are used as background in comparative analyses.

