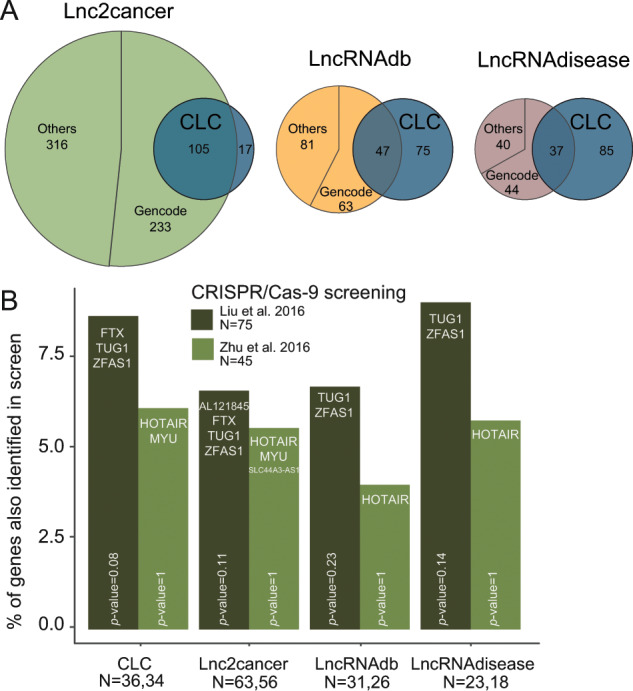
Fig. 2. Intersection of CLC with public databases.

a Proportional Venn diagrams displaying the overlap between CLC set and the three indicated databases. Shown are the total numbers of unique human lncRNAs contained in each intersection (note that for LncRNADisease, numbers refer only to cancer-related genes). Databases are divided into genes that belong to GENCODE v24 annotation and others. b Barplot shows the percent of GENCODE v24 lncRNAs of each database that is present in the final list of cancer lncRNA candidates of two CRISPR/Cas-9 cancer screenings (Liu et al.9 and Zhu et al.47). N represents the number of GENCODE v24 lncRNAs from each database that were tested in each of the two CRISPR/Cas-9 screenings. Names of the genes that overlap between the databases and the screenings are shown in each bar. p-values were calculated using Fisher’s exact test.
