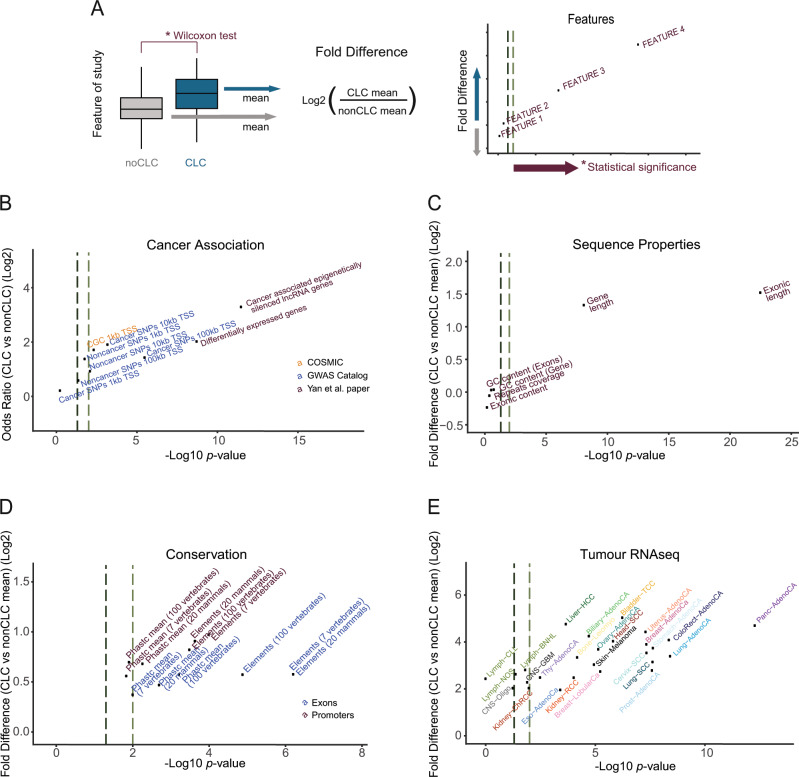
Fig. 4. Distinguishing features of CLC genes.
a Panel showing a hypothetic feature analysis example to illustrate the content of the following figures. All panels in this figure display features (dots), plotted by their log-fold difference (odds ratio in case of panel (b)) between CLC/non-CLC genesets (y-axis) and statistical significance (x-axis). In all plots dark and light green dashed lines indicate 0.05 and 0.01 significance thresholds, respectively. b Cancer and non-cancer disease-related data from indicated sources: y-axis shows the log2 of the odds ratio obtained by comparing CLC to non-CLC by Fisher’s exact test; x-axis displays the estimated p-value from the same test. “CGC 1 kb TSS” refers to the fraction of genes that have a nearby known CGC cancer protein-coding gene. This is explored in more detail in the next Figure. “Non-cancer SNPs” refers to GWAS SNPs associated with diseases/traits other than cancer. c Sequence and gene properties: y-axis shows the log2 fold difference of CLC/non-CLC means; x-axis represents the p-value obtained. d Evolutionary conservation: “Phastc mean” indicates average base-level PhastCons score; “Elements” indicates percent coverage by PhastCons conserved elements (see Methods). Colours distinguish exons (blue) and promoters (purple). e Tumour RNA-seq: expression levels of lncRNA genes in different cancer tissues obtained from RNA-seq expression data from PCAWG. For (b–d), statistical significance was calculated using Wilcoxon test.

