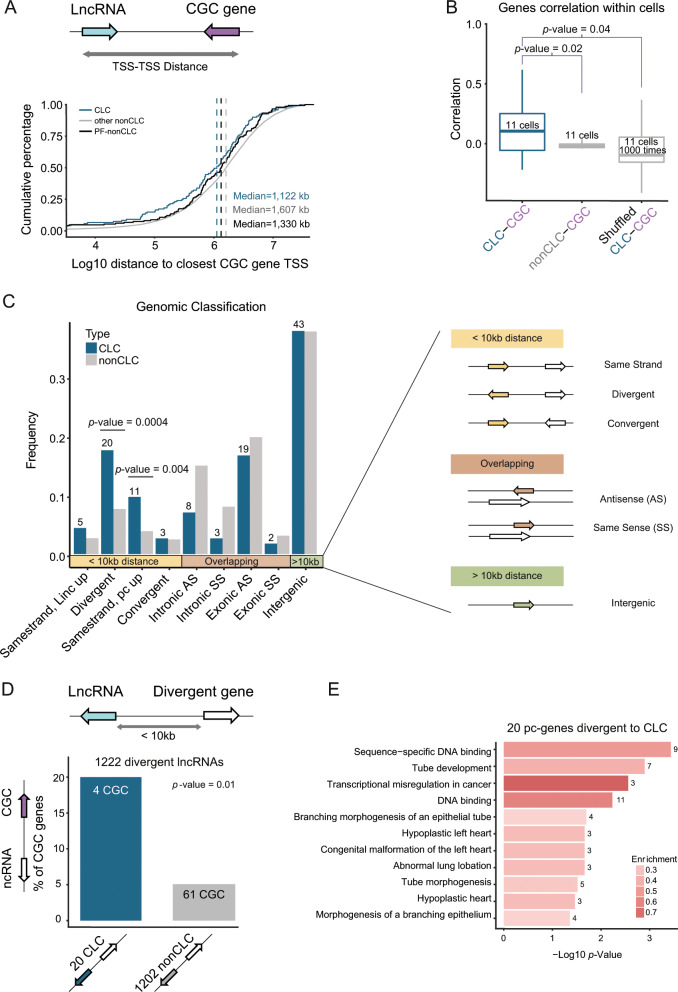
Fig. 5. Evidence for genomic clustering of non-coding and protein-coding cancer genes.
a Cumulative distribution of the genomic distance of lncRNA transcription start site (TSS) to the closest Cancer Gene Census (CGC) (protein-coding) gene TSS. LncRNAs are divided into CLC (n = 122), potentially functional non-CLC genes (PF-non-CLC) (n = 149), and other non-CLC genes (n = 15,678). b Boxplot shows the distribution of the gene expression correlation between CLC and their closest CGC genes in 11 human cell lines, including two control analyses (distance-matched non-CLC-CGC pairs, and shuffled CLC-CGC pairs). Correlation was calculated for gene pairs within each cell type, using Pearson method. p-value for Kolmogorov–Smirnov test is shown. c Genomic classification of lncRNAs. Genes are classified according to distance and orientation to the closest protein-coding gene, and these are grouped into three categories: genes closer than 10 kb to closest protein-coding gene, genes overlapping a protein-coding gene and intergenic genes (>10 kb from closest protein-coding gene). p-values for Fisher’s exact tests are shown. d The percentage of divergent CLC (left bar) and non-CLC (right bar) genes divergent to a cancer protein-coding gene (CGC). Numbers represent numbers of genes with which the percentage is calculated. p-value for Fisher’s exact test is shown. e Functional annotations of the 20 protein-coding genes (pc-genes) divergent to CLC genes from panel (c). Bars indicate the –log10 (corrected) p-value (see Methods) and are coloured based on the “enrichment”: the number of genes that contain the functional term divided by the total number of queried genes. Numbers at the end of the bars correspond to the number of genes that fall into the category.

