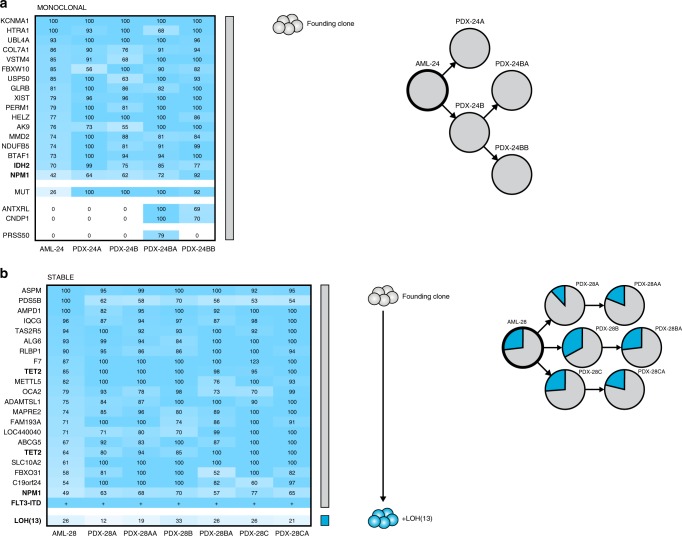
Fig. 2. The clonal composition is maintained in a minority of AML xenografts.
a A representative AML case with the Monoclonal pattern of clonal dynamics, where the patient sample only contains one detectable clone with AML-associated mutations or CNAs and this clone constitutes the entire xenografts. In AML-24, a single clone with IDH2 and NPM1 mutations gave rise to both the two primary and the two secondary xenografts, differing only in terms of nonrecurrent presumed passenger mutations. Left, the percentage of cells in patient samples and corresponding xenografts estimated to carry each genetic aberration, based on variant allele frequencies of identified mutations and b-allele frequencies of copy number alterations and copy-neutral losses of heterozygosity. Colored bars indicate defining mutations for each clone. Clones are represented by the same color throughout each panel. Middle, inferred clonal hierarchy. Right, proportions of each clone at diagnosis (AML, thick circles) and in xenografts (PDX, thin circles). Clones were defined by the presence of one or more recurrent AML mutations, CNAs or losses of heterozygosity (indicated in bold). b The only AML case with the Stable pattern of clonal dynamics, where clones in the patient sample retain their relative proportions in the xenografts. In AML-28, a subclone with loss of heterozygosity of chromosome 13 maintained its frequency from the patient sample in all three primary and three secondary xenografts. The presence of FLT3-ITD is denoted by +, as the rearrangement in this case is detectable but not quantifiable by WES.

