Figure 3.
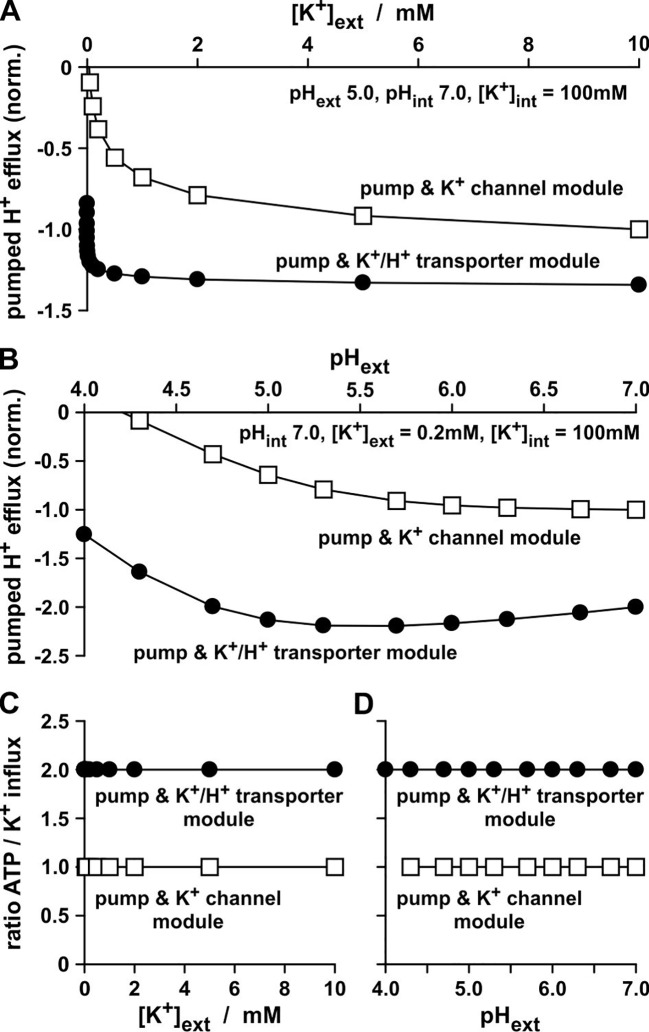
Proton pump activity during K+-uptake. (A, B) H+ flux via the pump measured in the in-silico K+-uptake experiments presented in Fig. 2D and E. The H+ fluxes were normalized to the K+ flux values measured for the channel-based module at [K+]ext = 10 mM (A), and pHext 7.0 (B). The negative values indicate H+ effluxes in contrast to the K+ influxes presented in Fig. 2D and E. (C, D) For each pumped proton an ATP molecule has be to hydrolyzed. Ratios of the consumed ATP molecules per accumulated K+ ion in the in-silico experiments presented in Figures 2D, E and 3 (A, B). To calculate the ratios, the absolute values of the data displayed in (A) were divided by the corresponding data from Figure 2D and the absolute values of the data displayed in (B) were divided by the corresponding data from Figure 2E.

