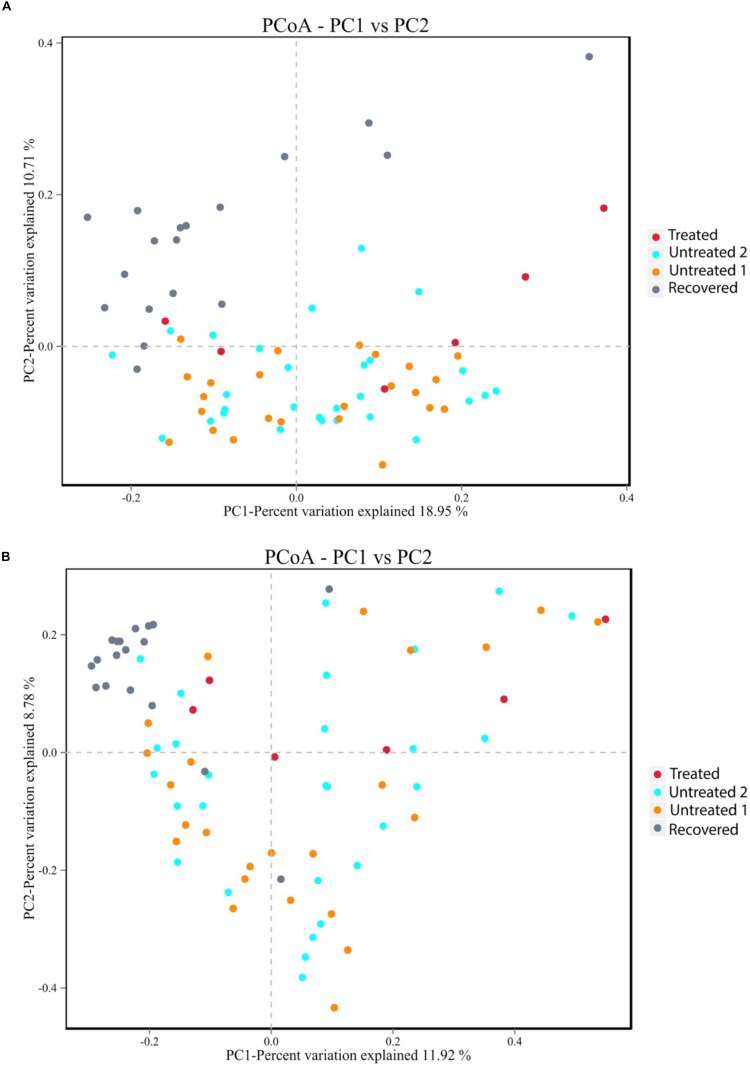
FIGURE 2.
Principal coordinate analysis plot based on (A) the unweighted UniFrac distance at the operational taxonomic unit (OTU) level and (B) the Bray-Curtis dissimilarity at the OTU level. Untreated group 1 and untreated group 2 are the sex and age matched controls for the multi-drug-resistant tuberculosis (MDR-TB) treated group and the MDR-TB recovered group, respectively.

